On November 2, 2026: price 914.80 GBp, trend sideways, RSI 48.1, support 895.80, resistance 945.20. technical analysis of segro stock. Segro Stock Gains — full…
By Alistair Sterling
November 3, 20264 min read
Logo Segro plc — JournalArta illustration
Segro closed at 914.80 GBp on the London Stock Exchange on Monday, November 2, after rising 0.29% in the session, as the industrial property group’s shares hovered near their 20-day average but remained below the 50-day line. The stock has not been covered by JournalArta in the past 14 days, while its latest technical signals point to a market waiting for direction rather than a confirmed turn.
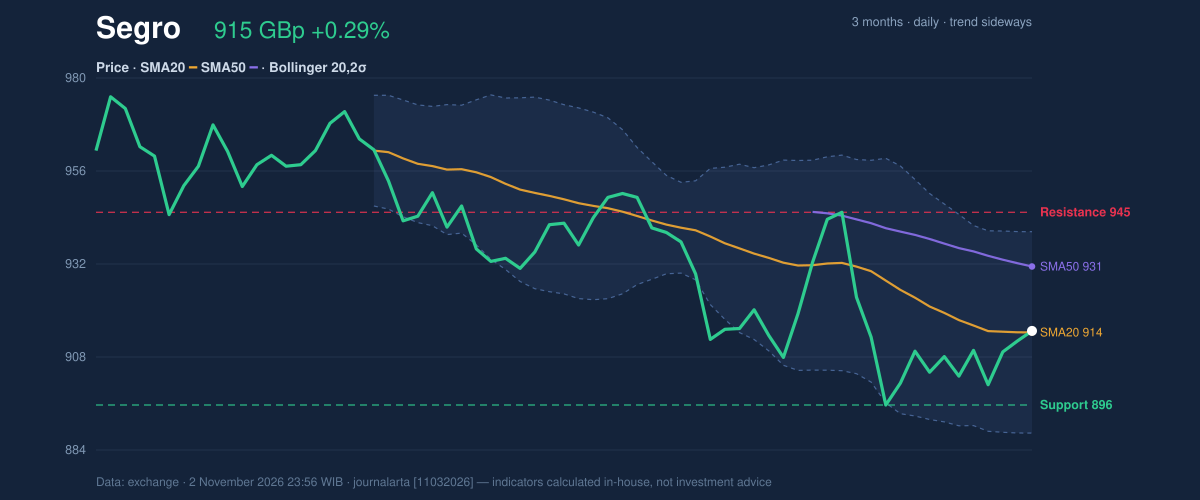
The move was modest. Segro gained 1.28% over five sessions but was down 0.07% over one month, consistent with a sideways pattern. Its price is only slightly above the 20-day simple moving average (SMA), a measure of the recent average closing price, at 914.41 GBp. But it remains below the 50-day SMA at 931.28 GBp, leaving the broader near-term structure unresolved.
Trend & Price Action
The 20-day average’s slope is negative: it fell 0.34% over five days. That matters because price sitting just above a falling average is weaker evidence than a sustained move above a rising one. There has been no new moving-average crossover, so the chart does not show a fresh signal that short-term direction has changed.
Segro sits at 38% of its 20-day trading range, between support at 895.80 GBp and resistance at 945.20 GBp. The broader three-month range runs from 888.00 to 977.00 GBp. These levels frame the current consolidation: a move toward resistance would test whether buyers can overcome the 50-day average, while a retreat would bring support and the three-month low into focus.
The Bollinger Bands, which measure price relative to a moving average and recent volatility, are narrowing. Their width is 5.6%, with the share near the middle band and %B at 51%. The squeeze signals compressed volatility and the potential for a larger move, but does not indicate which direction it will take.3-month price action chart of Segro: price, SMA20/50, Bollinger, support & resistance.
Oscillators & Momentum
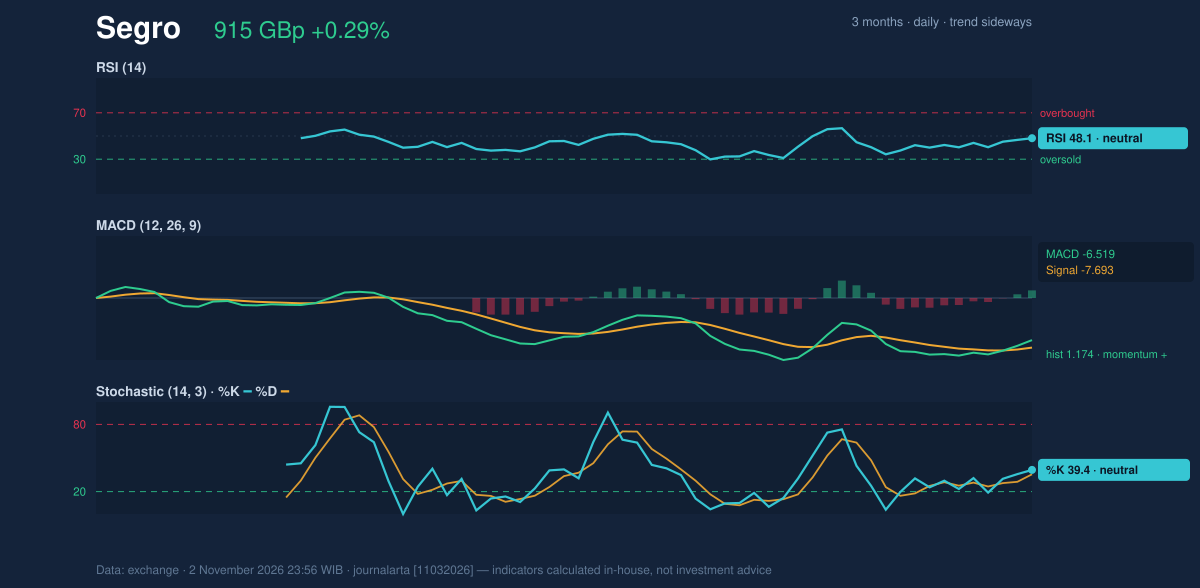
Momentum readings are mixed but not extreme. The 14-day Relative Strength Index (RSI), which measures the pace of recent gains and losses, is 48.1, while the Stochastic readings are 39.4 for %K and 35.5 for %D. Both indicators are neutral, offering neither an overbought warning nor a strong oversold-rebound signal.
The MACD histogram has turned positive at 1.174, with MACD at -6.519 and its signal line at -7.693. The histogram’s move above zero suggests improving short-term momentum: MACD is now above its signal line. But both remain below zero, so the improvement has not yet established a clear upward trend. The positive MACD histogram is the main bullish signal, while neutral RSI and Stochastic readings limit its confirmation.Momentum chart of Segro: RSI(14), MACD, Stochastic.
Volatility, Volume & Levels
Average True Range (ATR), a gauge of typical daily price movement, is 16.09 GBp, or 1.8% of the share price, indicating moderate volatility. The latest volume was 1,611,411 shares, below the 20-session average of 2,158,297. That lighter activity makes the day’s gain less persuasive as evidence of broad buying interest. On the other hand, On-Balance Volume (OBV), which tracks whether volume accompanies rising or falling prices, is rising.
Support is 895.80 GBp, with the three-month low at 888.00 GBp; resistance is 945.20 GBp, followed by the three-month high at 977.00 GBp. A sustained break above resistance would strengthen the case that momentum is carrying beyond the current range. Failure to hold support would instead put the lower three-month boundary in view. Until either level gives way, the narrowing bands and subdued volume leave the price structure vulnerable to a false move.
3-month price action chart of Segro: price, SMA20/50, Bollinger, support & resistance.
Technical Verdict: HOLD
The technical bias is neutral, supporting a hold-and-wait reading rather than a directional call. The strongest reasons are the price’s position between the 20-day and 50-day averages, neutral RSI and Stochastic readings, and the MACD histogram’s positive turn that has not yet lifted the MACD above zero. The verdict is invalidated if the price falls below 895.80 GBp, the 20-day support.
Indicative entry range: 895.80–914.41 GBp, bounded by 20-day support and the 20-day average.
Reference exit target: 945.20 GBp, the 20-day resistance.
Reference stop-loss protection: 888.00 GBp, the three-month low.
For non-traders, the signals are balanced: the share has a small improvement in momentum, but not enough confirmation to establish a clear trend.
Indicator
Reading
Last price
914.80 GBp
Change
1 day: 0.29% | 5 days: 1.28% | 1 month: -0.07%
SMA20 / SMA50
914.41 / 931.28 GBp
RSI(14)
48.1, neutral
Stochastic %K / %D
39.4 / 35.5, neutral
MACD histogram
1.174, positive
ATR(14)
16.09 GBp
Volume / 20-session average
1,611,411 / 2,158,297
Support / resistance
895.80 / 945.20 GBp
Summary Data Segro
Last price
914.80 GBp
Change 1 day / 5 days / 1 month
0.29% / 1.28% / -0.07%
Trend / MA-cross
sideways / none
SMA20 / SMA50
914.41 / 931.28
RSI (14) / Stochastic %K
48.1 / 39.4
Bollinger %B / ATR
51% / 16.09
Support / Resistance 20 days
895.80 / 945.20
Data as of
2 November 2026 23:56 WIB
Disclaimer: This technical analysis is generated automatically from exchange data and indicators calculated by JournalArta, for information and education only. The verdict and the entry, target and stop-loss levels are not investment advice or a solicitation to buy or sell any security. Investment decisions and their risks rest solely with the reader.