WPP Testing Key Resistance: Stock Gains 0.59% (November 2, 2026)
On November 2, 2026: price 408.00 GBp, trend uptrend, RSI 59.7, support 372.30, resistance 412.70. technical analysis of wpp stock. WPP Testing Key Resistance…

Why WPP is in focus today
- Volume at 1.9× the 20-day average
- Uptrend confirmed (5-day change 3.63%)
Selected automatically from 98 LSE (UK) stocks by a technical-signal score with daily weighted randomisation — not a recommendation.
Trend & Price Action
WPP traded above its 20-day simple moving average of 393.81 GBp and its 50-day average of 385.75 GBp. The 20-day average rose 1.37% over five days, indicating that the short-term trend is strengthening rather than merely reflecting a one-session jump. No new moving-average crossover was recorded, so the signal is a rising price structure, not a newly formed golden cross. The shares stood at 88% of their 20-day range, between support at 372.30 GBp and resistance at 412.70 GBp. The upper Bollinger Band, which marks a statistical boundary around recent trading, was at 414.43 GBp; the lower band was 373.18 GBp. With the price near the upper band and %B at 84%, WPP is approaching the upper end of its recent range, though the band width of 10.5% remains normal rather than unusually tight or expanded. The uptrend remains intact, but resistance near 412.70 GBp is the immediate test. A move through that level would bring the three-month high of 420.17 GBp into view; failure to clear it could leave the shares trading within the established range. The three-month low was 298.50 GBp, well below current trading.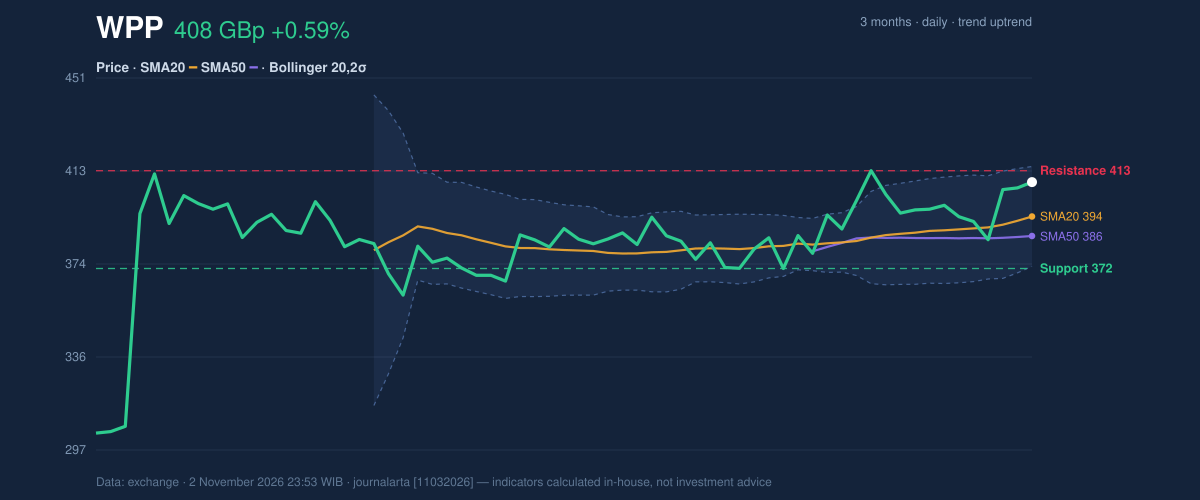
Oscillators & Momentum
Momentum indicators are positive without signalling an extreme. The Relative Strength Index (RSI), which gauges the pace of recent gains and losses, was 59.7, a neutral reading. The Stochastic oscillator was also neutral, with %K at 67.7 and %D at 65.5. These readings suggest buying pressure has not yet pushed the shares into commonly watched overbought territory. The MACD line stood at 5.425 against a signal line of 4.792, leaving a positive histogram of 0.633. That positive MACD histogram supports the upward move, although the provided signal describes it as just turned positive; it is a momentum confirmation, not proof that resistance will break. The broader technical screen records three bullish signals and no bearish signals, including the positive MACD histogram, the price above the 50-day average after a pullback toward the 20-day average, and rising OBV.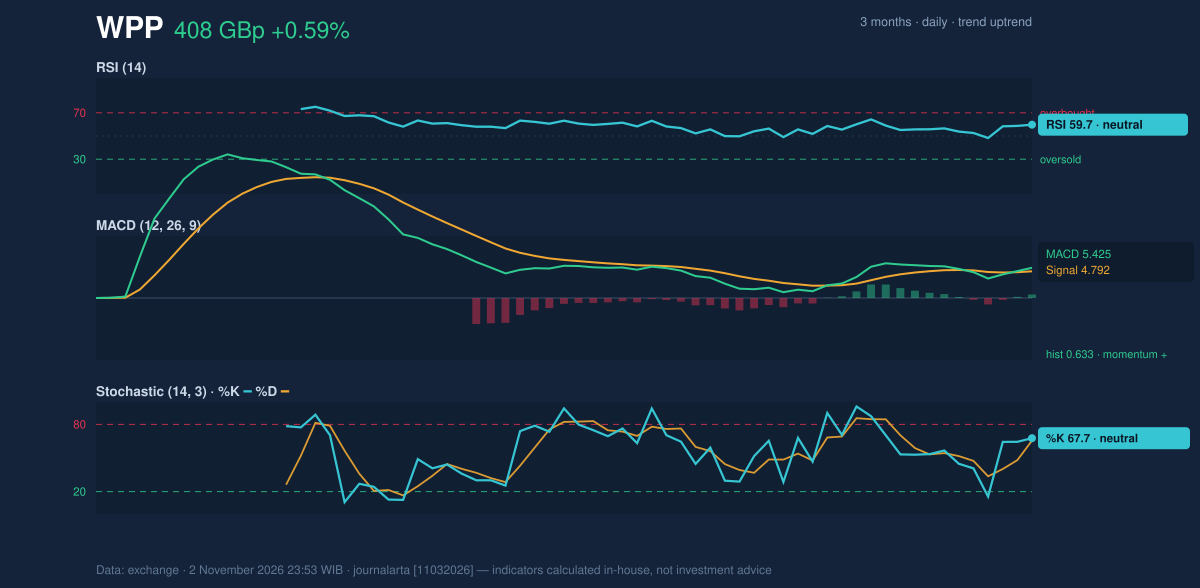
Volatility & Trading Activity
Volume reached 8,802,443 shares, or 1.9 times the 20-day average of 4,634,180. That surge gives the advance more participation than a thin-volume rise would have had, while OBV’s upward direction adds confirmation that net activity has been supportive. Average True Range (ATR), a measure of typical price movement, was 13.65 GBp, equal to 3.3% of the share price. That points to moderate volatility: the shares can move meaningfully within a session, but the data do not show an unusually wide volatility regime. The volume increase strengthens the trend signal, while the proximity of resistance makes follow-through important.Technical Verdict: BUY
The technical bias is bullish, and the indicators support a BUY verdict under the supplied signal framework. The strongest evidence is the positive MACD histogram at 0.633, the share price above both moving averages with the 20-day average rising, and rising OBV alongside volume at 1.9 times its average. The main constraint is that price is already near 20-day resistance at 412.70 GBp. The verdict is invalidated if WPP falls below the 20-day support at 372.30 GBp.- Ideal entry range: 393.81–408.00 GBp, framed by the 20-day average and the latest price.
- Exit target: 412.70 GBp, the next 20-day resistance; above that, the three-month high at 420.17 GBp is the next reference level.
- Stop-loss protection: 372.30 GBp, below 20-day support.
Summary Data WPP
| Last price | 408.00 GBp |
| Change 1 day / 5 days / 1 month | 0.59% / 3.63% / 9.56% |
| Trend / MA-cross | uptrend / none |
| SMA20 / SMA50 | 393.81 / 385.75 |
| RSI (14) / Stochastic %K | 59.7 / 67.7 |
| Bollinger %B / ATR | 84% / 13.65 |
| Support / Resistance 20 days | 372.30 / 412.70 |
| Data as of | 2 November 2026 23:53 WIB |
Disclaimer: This technical analysis is generated automatically from exchange data and indicators calculated by JournalArta, for information and education only. The verdict and the entry, target and stop-loss levels are not investment advice or a solicitation to buy or sell any security. Investment decisions and their risks rest solely with the reader.
Track WPP share price daily: live levels, support/resistance and our full WPP analysis history.