MSFT Testing Support Level: Stock Drops 2.83% (November 2, 2026)
On November 2, 2026: price 507.12 USD, trend sideways, RSI 39.6, support 507.12, resistance 543.45. technical analysis of msft stock. MSFT Testing Support…

Why MSFT is in focus today
- Volume at 1.5× the 20-day average
- Breaking out of a Bollinger squeeze (band width 5.9%)
- Not covered by JournalArta in the last 14 days
Selected automatically from 100 NASDAQ (US) stocks by a technical-signal score with daily weighted randomisation — not a recommendation.
Trend & Price Action
MSFT’s close was below both its 20-day moving average of $530.08 and its 50-day average of $513.39. The 20-day average itself rose 0.42% over five days, but that gradual upward slope has not prevented the share price from weakening. No new moving-average crossover formed, so the latest move is not yet part of a confirmed crossover trend. The stock finished at the bottom of its 20-day range: support was $507.12, while resistance was $543.45. It also closed below the lower Bollinger Band at $514.44, with %B at -23%. In plain terms, the price moved beneath the range defined by the recent average and volatility bands—a bearish break, though not by itself proof that the decline will continue. The Bollinger Band width had narrowed to 5.9%, a squeeze that signals unusually compressed recent movement and the potential for a larger move when that compression ends. The close below the band suggests the release has initially been downward. MSFT remains within its three-month range of $475.00 to $551.15, but its position near the lower end leaves little room for complacency around support.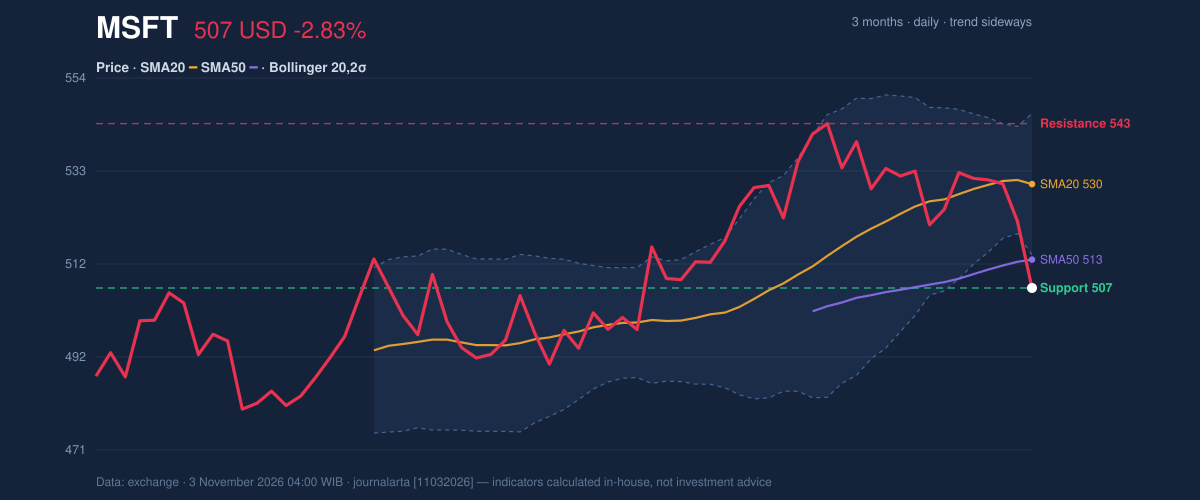
Oscillators & Momentum
Momentum indicators give a mixed rather than uniformly bearish message. The RSI is 39.6, a neutral reading, below the midpoint commonly associated with balanced momentum but not yet in oversold territory. The Stochastic is oversold, with %K at 5.3 and %D at 22.2. That can indicate selling has become stretched, but an oversold reading alone does not establish a reversal; the price still needs to show that demand is returning. The MACD is negative in momentum terms: its histogram is -3.179, with the MACD at 2.136 below its signal line at 5.315. That gap indicates weakening momentum, consistent with the close beneath the lower band. A divergence is not established by the supplied data, so the oversold Stochastic is best read as a warning that a bounce is possible—not as confirmation that one has begun.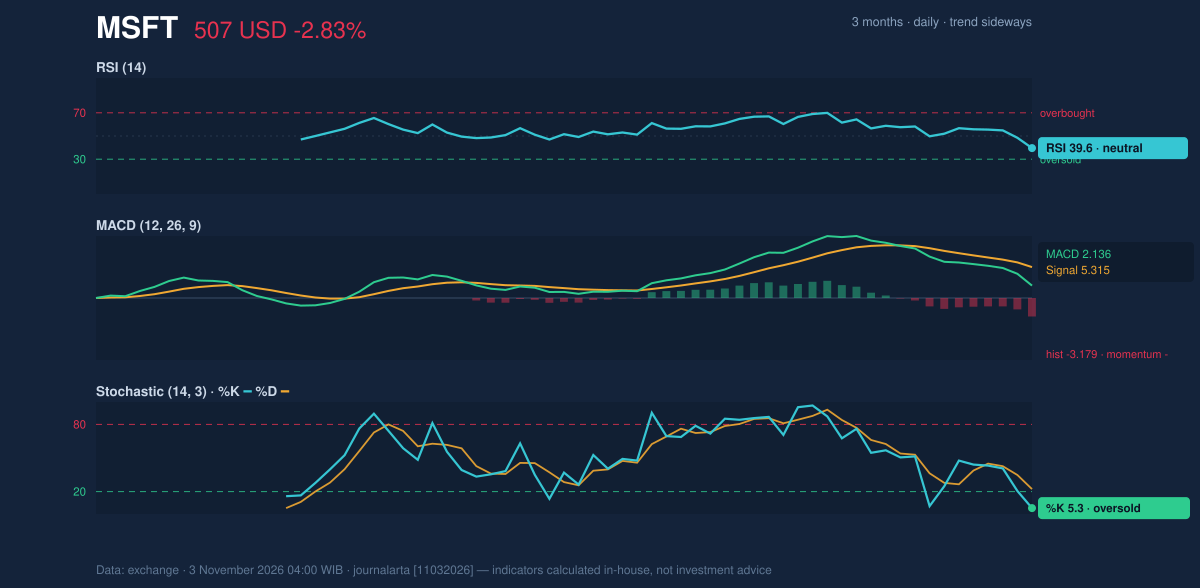
Volatility, Volume & Key Levels
Volume reached 34,624,100 shares, against a 20-day average of 22,416,050. High turnover makes the break more consequential than a decline on thin trading: more participants were involved. But on-balance volume (OBV) also fell, showing that cumulative buying and selling pressure is moving lower rather than confirming accumulation. Average true range, a measure of typical price movement, was $12.79, or 2.5% of the share price—moderate volatility. Reference levels based on that measure put a downside marker at $487.94 and an upside marker at $526.30. These are scenario guides, not forecasts. A sustained hold above $507.12 would help stabilize the near-term picture; a break below that support would put $487.94 in view as the next data-based downside reference, with the three-month low at $475.00 beyond it. Conversely, reclaiming the lower band at $514.44 and then the 50-day average at $513.39 would need careful interpretation: those levels are close, and a stronger recovery case would require the price to regain the 20-day average at $530.08. The nearest stated resistance is $543.45.Technical Verdict: HOLD (wait & see)
The neutral verdict matches the supplied technical bias. The strongest signals are the close below the lower Bollinger Band on a squeeze release, and the 1.5-times-average volume surge alongside falling OBV—both point to selling pressure. Against that, the Stochastic is oversold, while RSI remains neutral; neither confirms a durable trend in either direction. The verdict is invalidated on the downside if price breaks below $507.12, the stated 20-day support.- Ideal entry range: $507.12–$514.44, framed by 20-day support and the lower Bollinger Band.
- Exit target: $543.45, the 20-day resistance.
- Stop-loss protection: $487.94, the price-minus-1.5-ATR reference.
Summary Data MSFT
| Last price | 507.12 USD |
| Change 1 day / 5 days / 1 month | -2.83% / -4.78% / -3.44% |
| Trend / MA-cross | sideways / none |
| SMA20 / SMA50 | 530.08 / 513.39 |
| RSI (14) / Stochastic %K | 39.6 / 5.3 |
| Bollinger %B / ATR | -23% / 12.79 |
| Support / Resistance 20 days | 507.12 / 543.45 |
| Data as of | 3 November 2026 04:00 WIB |
Disclaimer: This technical analysis is generated automatically from exchange data and indicators calculated by JournalArta, for information and education only. The verdict and the entry, target and stop-loss levels are not investment advice or a solicitation to buy or sell any security. Investment decisions and their risks rest solely with the reader.
Track MSFT stock price daily: live levels, support/resistance and our full MSFT analysis history.