Testing Support Level, AMAT Stock Drops 3.99% on Monday
On November 2, 2026: price 374.53 USD, trend downtrend, RSI 33.3, support 374.53, resistance 530.27. technical analysis of amat stock. Testing Support Level —…

Why AMAT is in focus today
- Trading near its 3-month low (372.80)
- Downtrend extending (5-day change -3.37%)
Selected automatically from 100 NASDAQ (US) stocks by a technical-signal score with daily weighted randomisation — not a recommendation.
Trend & Price Action
The stock fell 3.37% over five days and 30.93% over one month, according to the supplied market data. It ended at the bottom of its 20-day trading range, whose support reference is $374.53, and close to the three-month low of $372.80. That proximity makes the next sessions important: a move under the recent low would deepen the damage, while a hold could mark an attempt to stabilize. The broader trend remains down. The price is below the 20-day simple moving average (SMA) of $434.04 and the 50-day SMA of $455.30; a moving average smooths price fluctuations to show the prevailing direction. The 20-day average itself fell 6.83% over five days, evidence that weakness is not confined to a single session. No new moving-average crossover has formed, so there is no fresh technical signal suggesting the trend has turned. The shares are under both key averages and near the three-month floor, while the data’s overall technical bias remains neutral.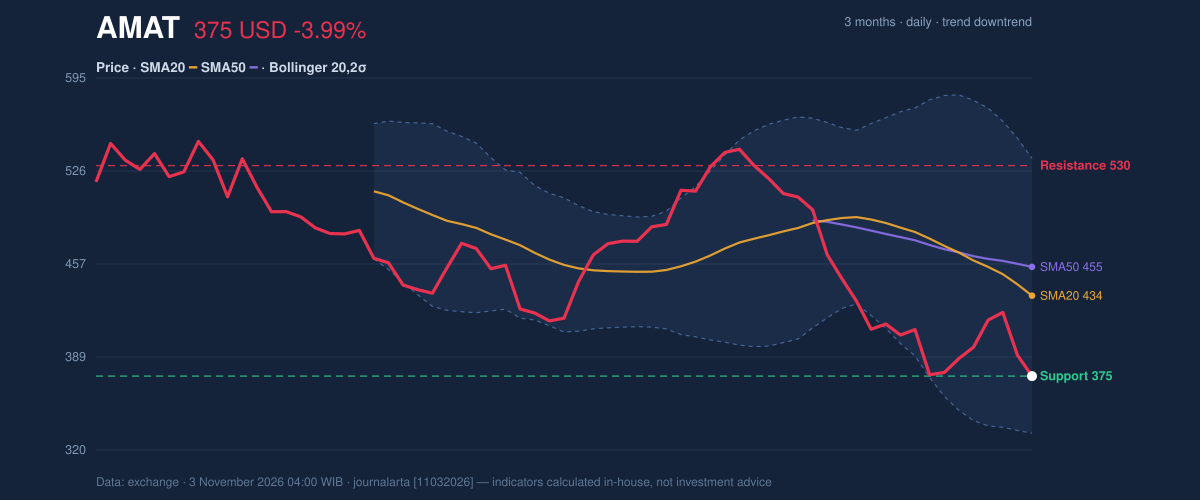
Oscillators & Momentum
Momentum indicators show pressure, but not a clean reversal. The RSI is 33.3, classified as neutral in the data. RSI measures the pace of recent gains and losses; a low reading can indicate that selling has been intense, but it does not, by itself, establish that a rebound is under way. The Stochastic is oversold, with %K at 2.0 and %D at 18.4. This indicator compares a closing price with its recent trading range. Its extreme reading says the price has been closing near the bottom of that range, a condition that can precede a bounce—but can also persist during a strong decline. The MACD is negative at −24.499, below its signal line at −21.293, with a −3.206 histogram. That alignment indicates downward momentum remains in force rather than confirming a turn. Oversold Stochastic readings flag stretched selling, but negative MACD offers no confirmation that momentum has reversed.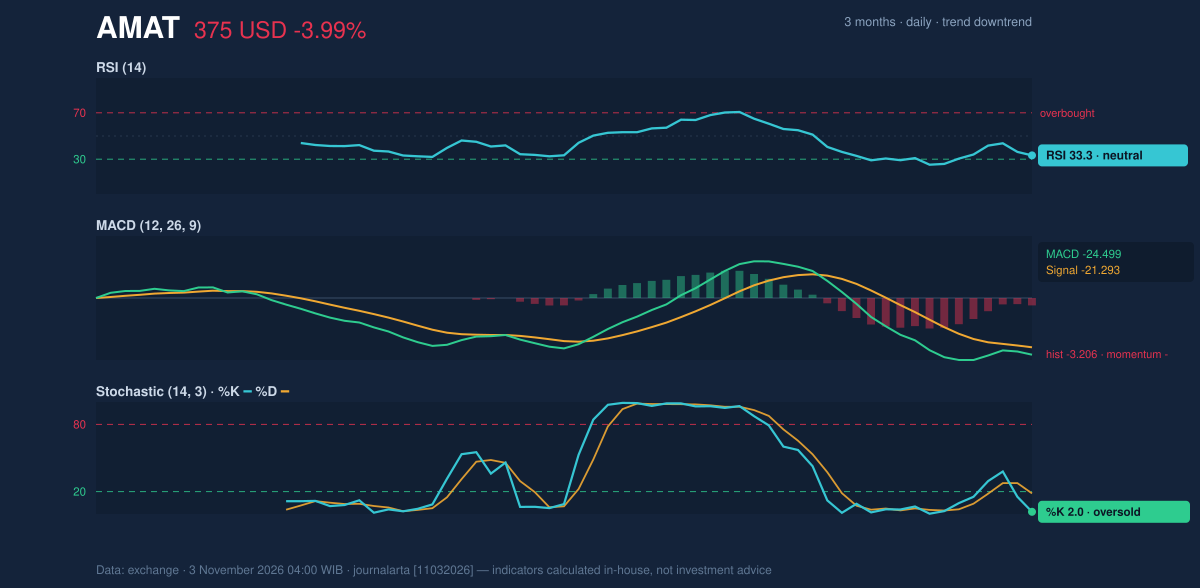
Volatility, Volume & Levels
Volatility is elevated. The Bollinger Bands, which expand when price swings grow, are widening, with a 46.8% band width. The price sits at 21% of the band range, closer to the lower band at $332.41 than to the middle line at $434.04. The upper band is $535.67. This structure reflects pronounced downside pressure and a wide potential trading range, not a reliable signal that price must revert toward the middle. The 14-day average true range (ATR), a measure of typical price movement, is $20.98, or 5.6% of the share price. The latest volume was 7,824,900 shares, about 1.1 times the 20-day average of 7,365,790. On-balance volume (OBV), which tracks whether volume is associated with buying or selling days, is rising. That divergence may suggest some accumulation beneath the weak price action, but it has not yet outweighed the falling averages and negative MACD. The immediate reference area is $372.80–$374.53, spanning the three-month low and 20-day support. A break below that zone would put $343.06—the supplied price-minus-1.5-ATR level—in view as a volatility-based reference. A recovery would first need to address $406.00, the price-plus-1.5-ATR level, before the more distant $434.04 20-day average. The next listed resistance is $530.27, with the three-month high at $563.76.Technical Verdict: HOLD (wait & see)
The data’s computed technical bias is neutral, with zero of seven bullish and zero of seven bearish signals, so the verdict remains on hold despite the clearly weak trend. The strongest reasons are the price’s position below both moving averages, the falling 20-day average, and negative MACD. Oversold Stochastic and rising OBV complicate the picture, but neither confirms a reversal. - Indicative entry range: $372.80–$374.53, the three-month low and 20-day support area. - Reference exit target: $434.04, the 20-day moving average. - Reference stop-loss protection: $343.06, the supplied price-minus-1.5-ATR level. - Invalidation: The hold thesis is invalidated if price falls below $372.80, the three-month low. These levels describe a technical framework, not an investment recommendation. In plain English, the shares are near a major low, but the evidence is not yet strong enough to call a sustained recovery.Market Data
| Metric | Reading |
|---|---|
| Last price | $374.53 |
| Session | Monday, November 2, 2026 |
| Daily / five-day / one-month change | −3.99% / −3.37% / −30.93% |
| SMA20 / SMA50 | $434.04 / $455.30 |
| RSI / Stochastic | 33.3 / oversold |
| MACD / signal / histogram | −24.499 / −21.293 / −3.206 |
| ATR14 | $20.98 (5.6%) |
| 20-day support / resistance | $374.53 / $530.27 |
| Three-month low / high | $372.80 / $563.76 |
Summary Data AMAT
| Last price | 374.53 USD |
| Change 1 day / 5 days / 1 month | -3.99% / -3.37% / -30.93% |
| Trend / MA-cross | downtrend / none |
| SMA20 / SMA50 | 434.04 / 455.30 |
| RSI (14) / Stochastic %K | 33.3 / 2.0 |
| Bollinger %B / ATR | 21% / 20.98 |
| Support / Resistance 20 days | 374.53 / 530.27 |
| Data as of | 3 November 2026 04:00 WIB |
Disclaimer: This technical analysis is generated automatically from exchange data and indicators calculated by JournalArta, for information and education only. The verdict and the entry, target and stop-loss levels are not investment advice or a solicitation to buy or sell any security. Investment decisions and their risks rest solely with the reader.
Track AMAT stock price daily: live levels, support/resistance and our full AMAT analysis history.