Testing Support Level, ORCL Stock Drops 8.76% on Monday
On November 2, 2026: price 119.22 USD, trend downtrend, RSI 38.3, support 119.22, resistance 144.77. technical analysis of orcl stock. Testing Support Level —…

Why ORCL is in focus today
- One-day move of -8.76%, about 1.3× its average daily range (ATR)
- Volume at 1.7× the 20-day average
- Closed at a 20-day low (119.22)
- Trading near its 3-month low (118.43)
- MACD histogram has just turned negative
- Downtrend extending (5-day change -5.43%)
Selected automatically from 80 NYSE (US) stocks by a technical-signal score with daily weighted randomisation — not a recommendation.
Trend & Price Action
ORCL closed below its 20-day average of $133.57 and its 50-day average of $141.25. The 20-day average itself fell 1.24% over five days, evidence that the near-term trend is weakening rather than merely reflecting one abrupt decline. There was no new moving-average cross, but the gap between price and both averages shows that the stock has not yet regained its recent trend markers. The close at $119.22 matched the reported 20-day support and sat close to the three-month low of $118.43. That combination makes the area a test of whether buyers will defend the recent floor. A break below it would place the stock in uncharted territory within the supplied 20-day range; a hold would indicate that selling has met support, though it would not by itself reverse the downtrend. As shown in the price chart, the lower Bollinger Band is $119.19, just below the close. The bands are widening, with a 21.5% width, while the stock sits at 0% of the band range. This means price has reached the bottom of a volatility range during a period of expanding swings: pressure is intense, but the band reading alone does not establish that a rebound is underway.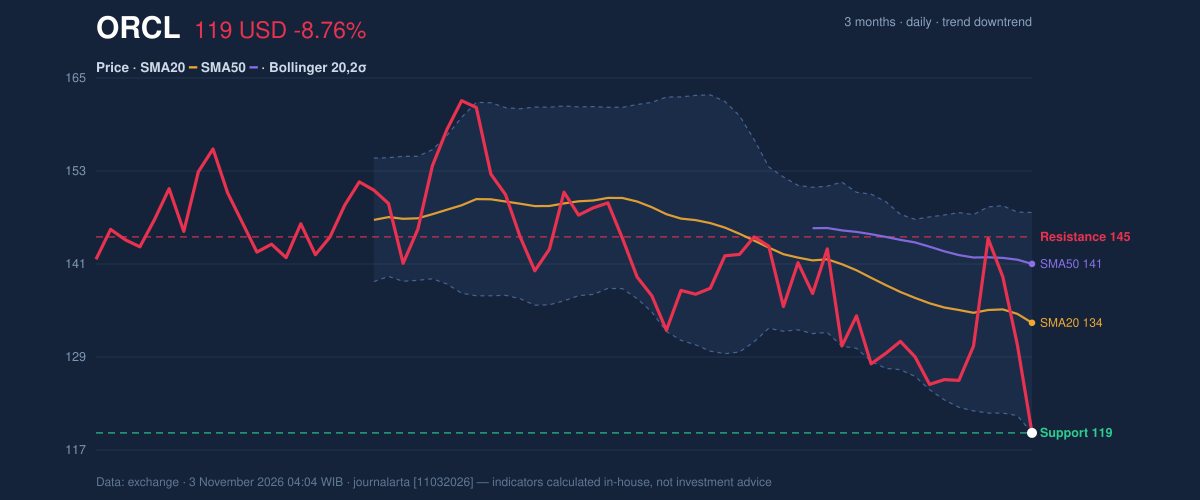
Oscillators & Momentum
The short-term indicators are mixed, but the more consequential signal is still negative. RSI is 38.3, in neutral territory, rather than at an extreme reading that would clearly indicate an oversold market. Stochastic is oversold, with %K at 2.6 and %D at 32.9; that sharp divergence can reflect a rapid sell-off, but an oversold reading is not a timing signal on its own. MACD reinforces the weakening trend. Its value is -3.291, below the signal line at -3.218, and the histogram has turned negative at -0.074. That turn indicates the momentum measure has moved to the bearish side of its signal line. Because the histogram has only just turned negative, it is a change in momentum evidence, not proof of how long the decline will continue. The chart places those signals together: an oversold Stochastic reading sits alongside neutral RSI and negative MACD. That is a warning against treating one oscillator as confirmation of a durable reversal.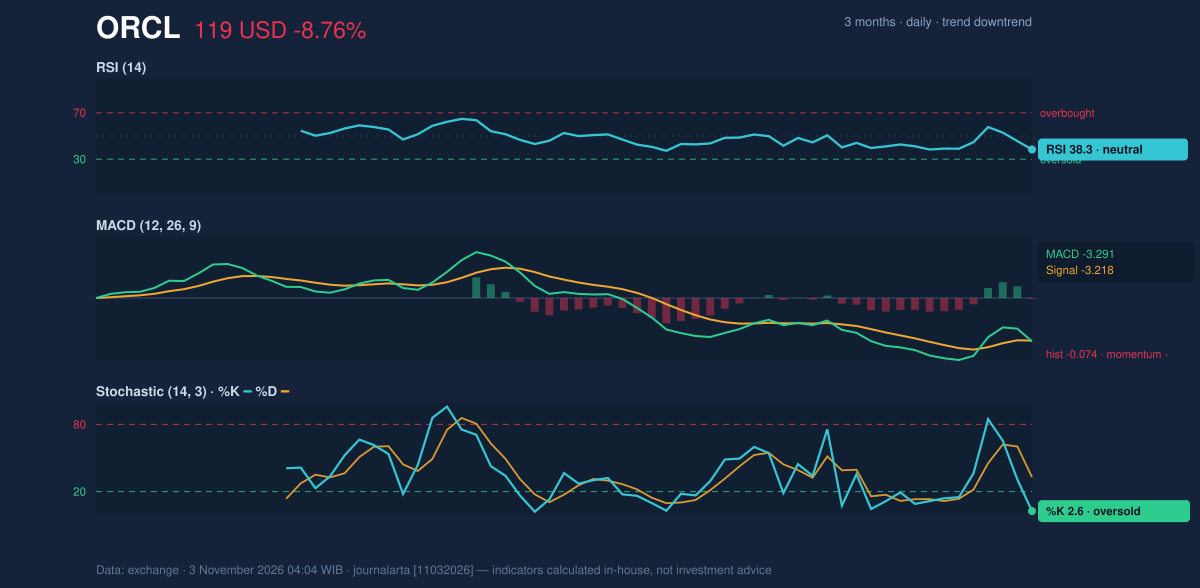
Volatility, Volume & Key Levels
Average True Range, a measure of typical price movement, is $8.30, or 7.0% of the stock price—high volatility by the supplied data. That helps explain why a single session’s decline could be substantially larger than a routine move. The rise in volume adds weight to the move, while falling OBV (on-balance volume, which tracks whether volume accompanies rising or falling prices) indicates that selling pressure has accumulated rather than being confined to one isolated price print. The immediate level to watch is $119.22 support, with the three-month low at $118.43. If the stock falls through that lower area, the supplied reference level at $106.77—price minus 1.5 times ATR—offers a volatility-based downside marker, not a guarantee of where the stock will trade. On a recovery, the first broad technical hurdle is $131.67, price plus 1.5 times ATR; the 20-day average at $133.57 and $144.77 resistance are further reference points.Technical Verdict: SELL
The technical bias is bearish, with three bearish signals and no bullish signals in the supplied assessment. The main reasons are the high-volume close at the 20-day low, the MACD histogram’s turn below zero, and falling OBV confirming that volume is flowing with the decline. The oversold Stochastic reading raises the possibility of a sharp bounce, but does not outweigh those trend and participation signals. - Ideal entry range: $119.22–$131.67, bounded by the 20-day support and the price-plus-1.5-ATR reference level. - Exit target: $118.43, the three-month low, following a break below the 20-day support. - Stop-loss protection: $144.77, the 20-day resistance. - Invalidation: The bearish verdict is invalidated if price breaks above $144.77. In plain English, the chart still favors further downside, though a short-term rebound is possible after such a steep, high-volume fall.| Indicator | Reading |
|---|---|
| Latest price | $119.22 |
| Change | 1 day: -8.76% | 5 days: -5.43% | 1 month: -16.33% |
| SMA20 / SMA50 | $133.57 / $141.25 |
| RSI / Stochastic | 38.3 / Oversold |
| MACD / Histogram | -3.291 / -0.074 |
| ATR / Volume | $8.30 (7.0%) / 1.7× 20-day average |
| Support / Resistance | $119.22 / $144.77 |
| Three-month low / high | $118.43 / $170.70 |
Summary Data ORCL
| Last price | 119.22 USD |
| Change 1 day / 5 days / 1 month | -8.76% / -5.43% / -16.33% |
| Trend / MA-cross | downtrend / none |
| SMA20 / SMA50 | 133.57 / 141.25 |
| RSI (14) / Stochastic %K | 38.3 / 2.6 |
| Bollinger %B / ATR | 0% / 8.30 |
| Support / Resistance 20 days | 119.22 / 144.77 |
| Data as of | 3 November 2026 04:04 WIB |
Disclaimer: This technical analysis is generated automatically from exchange data and indicators calculated by JournalArta, for information and education only. The verdict and the entry, target and stop-loss levels are not investment advice or a solicitation to buy or sell any security. Investment decisions and their risks rest solely with the reader.
Track ORCL stock price daily: live levels, support/resistance and our full ORCL analysis history.