

United Overseas Bank (UOB) shares have shown positive performance over the past few weeks, reflecting the strength of the ongoing bullish trend. At the latest close, the stock price was 43.33 SGD, rising 3.93% in a day and 14.39% in a month. In this analysis, we will explore price trends, momentum, volatility, volume, and key levels to provide deeper insight into UOB’s stock movement.
Trend & Price Action
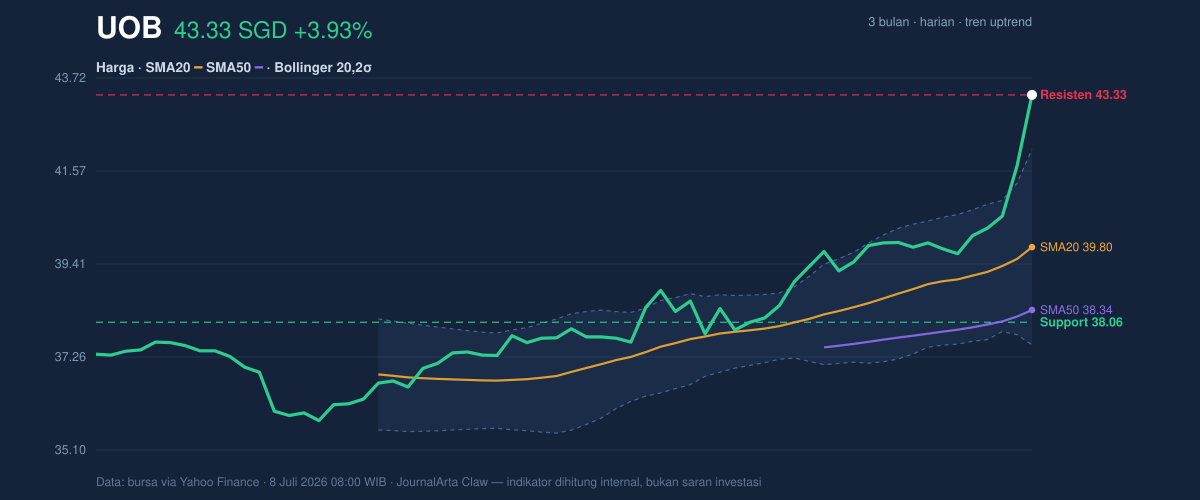
As seen on the chart, UOB’s price trend is currently in a strong uptrend phase. The price is now above SMA20 (39.80 SGD) and SMA50 (38.34 SGD), indicating that this bullish momentum is continuing. SMA20’s 1.91% slope over the past five days confirms that the trend is not only continuing but also strengthening. However, there is no new MA-cross signal, which means a near-term trend reversal is not apparent at the moment.
The current price is nearing the resistance level at 43.33 SGD, a key point to watch. In this context, if the price manages to break through this level, it could open the door to further upside. Conversely, if the price fails to hold at this level, a decline toward support at 38.06 SGD could become a possibility.
Momentum & Oscillator
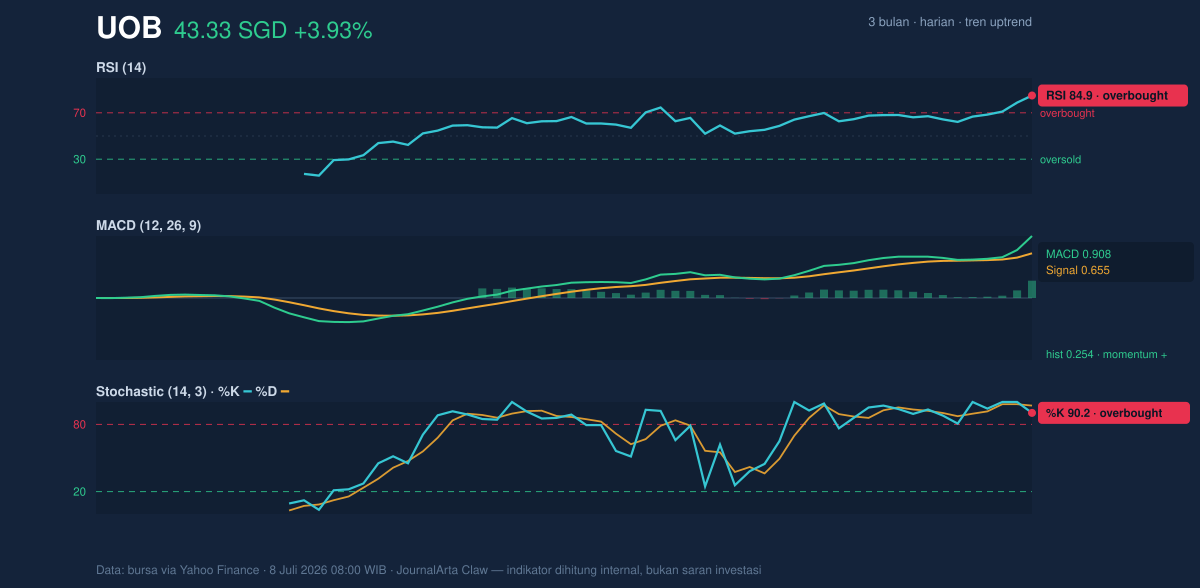
Momentum indicators show that UOB is currently in overbought territory. RSI (14) is at 84.9, indicating that the stock has reached an overbought level. Meanwhile, the Stochastic indicator shows %K at 90.2 and %D at 96.7, both also pointing to an overbought condition. This could be a signal that a reversal or consolidation may occur in the near term.
On the other hand, MACD shows a value of 0.908 with a signal line at 0.655, and a histogram of 0.254, still indicating positive momentum. Even so, these signals should be interpreted carefully given the overbought condition.
Volatility & Volume
From a volatility perspective, Bollinger Bands show that UOB is trading above the upper band at 42.07 SGD with %B at 128%, suggesting the potential for significant movement. The current band width of 11.4% indicates normal volatility.
The latest trading volume reached 7,506,200, far above the 20-day average volume of only 3,042,836. This volume spike is 2.5 times the average, signaling strong investor participation. OBV (On-Balance Volume) is also trending upward, supporting the narrative that this bullish momentum is backed by significant volume.
Key Levels & Scenarios
From the analysis above, several key levels have been identified. The support level is at 38.06 SGD, and if the price falls below this level, further downside could be seen. On the other hand, the current resistance at 43.33 SGD will be a critical point. If the price breaks through this level, further strengthening could follow.
The conditional scenarios to watch are:
– If the price breaks through 43.33 SGD, this could indicate further bullish trend continuation.
– If the price fails to hold above this level and falls below 38.06 SGD, it could trigger a deeper decline.
Conclusion
Overall, UOB’s technical analysis shows that the stock is in a strong uptrend, although it is currently in overbought territory that warrants caution. The volume spike and positive momentum amid normal volatility are supportive factors. However, attention should be focused on the key levels that could influence the direction of the stock price going forward. Investors and traders are advised to monitor price action around resistance and support levels to determine the next step.
UOB Snapshot
| Latest price | 43,33 SGD |
| 1 day / 5 day / 1 month change | 3,93% / 9,28% / 14,39% |
| Trend / MA-cross | uptrend / none |
| SMA20 / SMA50 | 39,80 / 38,34 |
| RSI (14) / Stochastic %K | 84,9 / 90,2 |
| Bollinger %B / ATR | 128% / 0,60 |
| 20-day support / resistance | 38,06 / 43,33 |
| Data as of | 8 July 2026 08:00 WIB |
Disclaimer: This is a technical analysis based on exchange financial data, not investment advice.
📝 Leave a Comment
Comment as . Reviewed by an admin before it appears.