UNH Stock Analysis: Gains 0.64%, Testing Key Resistance
On Juli 20, 2026: price 426.09 USD, trend uptrend, RSI 58.2, support 400.96, resistance 431.68. technical analysis of unh stock. UNH Stock Analysis — full…
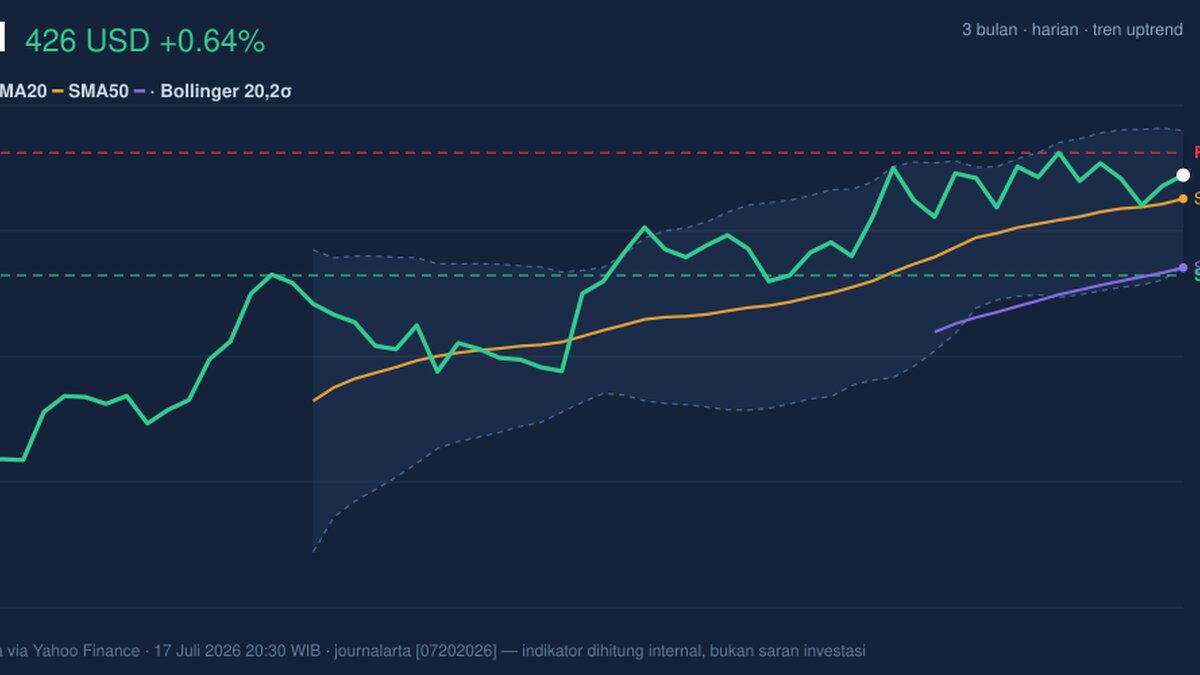
UnitedHealth Group shares edged higher on the New York Stock Exchange on Thursday, closing at $426.09 — up 0.64% on the day — as trading volume swelled to 10.7 million shares, roughly 1.6 times the 20-day average. The move looks small. The context is not. The largest U.S. health insurer has climbed 6.65% over the past month, extending a recovery from its three-month low of $320.12, and the latest session's heavy participation suggests institutional money is re-engaging rather than drifting away. The question now is whether buyers have enough momentum to punch through the ceiling directly overhead.
Trend & Price Action
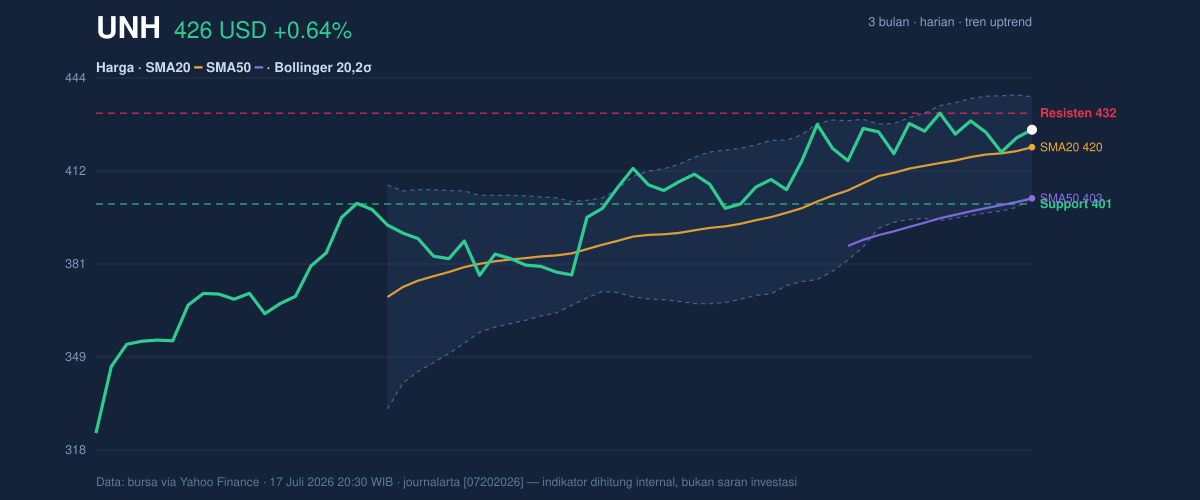
The trend structure remains firmly constructive. UNH trades above its 20-day simple moving average at $420.19, and that average is itself rising at a slope of 1.08% per five sessions — a steady, not frantic, ascent. More importantly, the 20-day line sits well above the 50-day line at $402.88, a bullish alignment that tells us the intermediate uptrend is intact even without a fresh crossover signal. On the Bollinger Bands, the stock's %B reading of 67% places it in the upper half of its recent range — firm, but not stretched — while its position at 82% of the 20-day range confirms buyers are in control of the short-term tape. The catch: price is now pressing directly into resistance at $431.68.
Momentum: A Pause, Not a Reversal
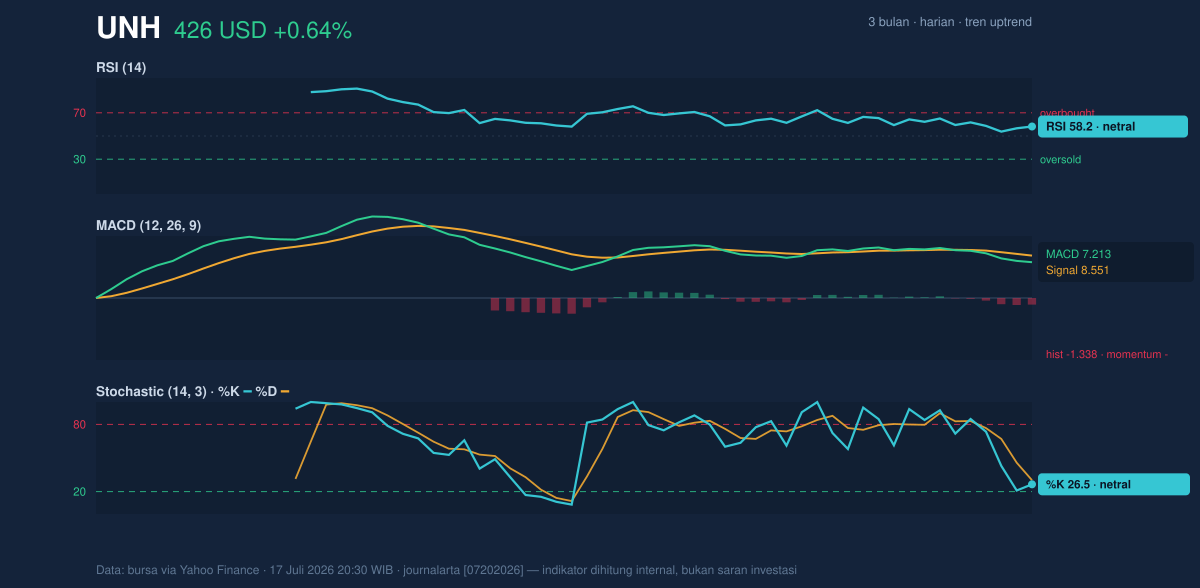
Here the picture gets more nuanced. The RSI at 58.2 sits in neutral territory — neither overbought above 70 nor oversold below 30 — which means the rally has room to breathe in either direction. The Stochastic oscillator, with %K at 26.5 crossing below %D at 30.1, points to short-term cooling: the most recent buying impulse is fading. The MACD tells the same story in two parts. The MACD line at 7.213 remains above zero, confirming the underlying trend is still up, but it has slipped below its signal line at 8.551, leaving a negative histogram of -1.338. Think of it as a car still in top gear but off the throttle — direction unchanged, pace decelerating. This is a momentum pause inside an uptrend, not yet a trend reversal.
Volatility & Volume: Institutions Are Back at the Table
Average True Range — a measure of how much the stock typically moves in a day — stands at $12.76, or 3.0% of the share price. That is moderate volatility: wide enough to matter, calm enough to manage. Bollinger Band width of 8.1% is normal, meaning there is no "squeeze" coiling up for an explosive move, nor any panic-driven expansion. The real story is volume. A 1.6× surge on an up day, with On-Balance Volume trending higher, is a classic accumulation signature — money flowing in faster than it flows out. One caveat worth noting: heavy volume producing only a 0.64% gain directly beneath resistance also implies sellers are meeting buyers at $431.68. Both sides have shown up. Something has to give.
Key Levels & Scenarios
The battleground is clearly defined. Resistance sits at $431.68; a decisive close above it would open the path toward the upper Bollinger Band at $437.22, and beyond that the three-month high of $461.62. On the downside, the first cushion is the 20-day average at $420.19. Below that lies a dense support cluster: the lower Bollinger Band at $403.16 and the 50-day average at $402.88, effectively guarding key support at $400.96. If the stock breaks $431.68 on strong volume, the uptrend resumes with fresh targets. If it fails to hold $420, expect a test of the $403 area. A break of $400.96 would damage the entire bullish structure.
Technical Verdict: HOLD
HOLD (wait & see). Three reasons drive this call. First, the trend is unambiguously bullish — price above a rising 20-day average, bullish 20/50 alignment, and rising OBV on a 1.6× volume surge. Second, momentum is decelerating at the worst possible spot: the negative MACD histogram and soft Stochastic arrive just as price presses into $431.68 resistance, making this a poor location to chase. Third, a neutral RSI at 58.2 offers no edge in either direction — patience is the position. This verdict is invalidated if the price falls below $400.96, which would simultaneously break the 50-day average and lower Bollinger floor.
- Entry Range: $420.19–$426.00, accumulating on pullbacks toward the 20-day average; alternatively, on a confirmed close above $431.68
- Exit Target: $437.22 (upper Bollinger Band), extended target $461.62 (three-month high)
- Stop Loss: A close below $400.96, beneath the $402.88–$403.16 support cluster
In plain English: the stock's recovery is real and big investors are participating, but it is knocking on a ceiling — the smarter move is to let the $431.68 test resolve before committing fresh capital. This is technical analysis based on market data, not an investment recommendation.
Summary Data UNH
| Last price | 426.09 USD |
| Change 1 day / 5 days / 1 month | 0.64% / 0.35% / 6.65% |
| Trend / MA-cross | uptrend / none |
| SMA20 / SMA50 | 420.19 / 402.88 |
| RSI (14) / Stochastic %K | 58.2 / 26.5 |
| Bollinger %B / ATR | 67% / 12.76 |
| Support / Resistance 20 days | 400.96 / 431.68 |
| Data as of | 17 Juli 2026 20:30 WIB |
Track UNH stock price daily: live levels, support/resistance and our full UNH analysis history.