Singtel Stock Drops 0.90% Today, Testing Support Level
On Juli 21, 2026: price 4.40 SGD, trend sideways, RSI 47.4, support 4.35, resistance 4.47. technical analysis of singtel stock. Singtel Stock Drops — full…

Singapore Telecommunications (Singtel) shares slipped 0.90% to 4.40 SGD on the Singapore Exchange on 20 July, according to bourse data via Yahoo Finance, a modest daily loss that nonetheless dragged Southeast Asia's benchmark telecom stock back below its short-term trend line. The one-month gain of 0.92% masks what the tape actually shows: a market going nowhere fast, coiling into one of its tightest ranges of the quarter. For chart-watchers, the message is patience, not panic.
Trend & Price Action: Flat Lines, Tight Corridor
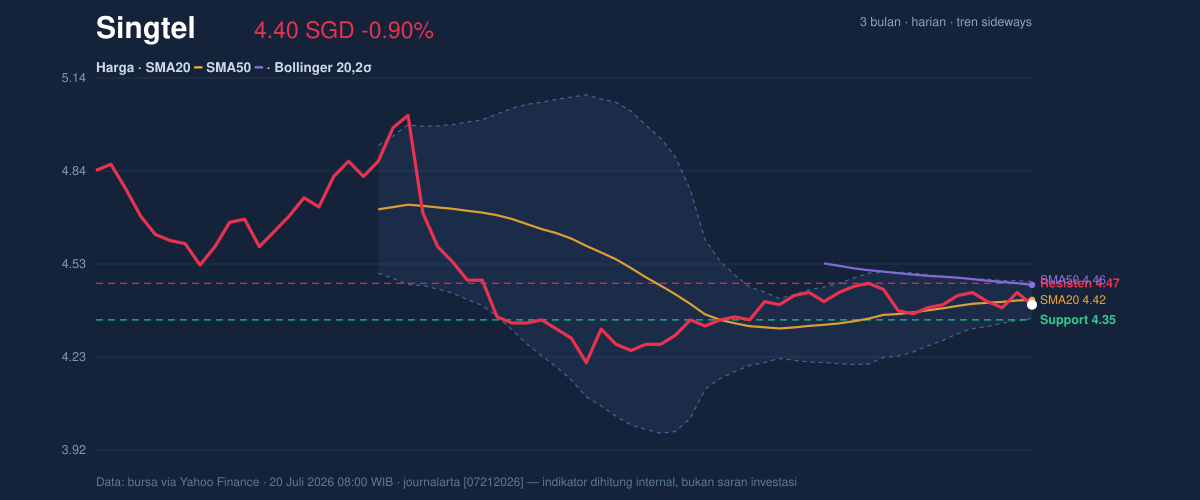
The trend picture is unambiguous in its ambiguity. Singtel closed below both the 20-day moving average at 4.42 and the 50-day at 4.46, and the 20-day line itself is rising just 0.44% every five days — a slope so gentle it qualifies as sideways rather than upward. Moving averages smooth out daily noise to reveal direction; here, they reveal the absence of it. No new crossover between the two averages has formed, meaning neither a bullish "golden cross" nor a bearish "death cross" is in play.
Context sharpens the picture. Over three months, Singtel has traded between 5.05 and 4.15, and the current price sits far closer to the floor of that span than the ceiling. Within the recent 20-day corridor, the stock sits at just 42% of the range, as shown in the chart below — a positioning that speaks to sellers holding a slight, but not decisive, edge.
Momentum: Mixed Signals Beneath a Calm Surface
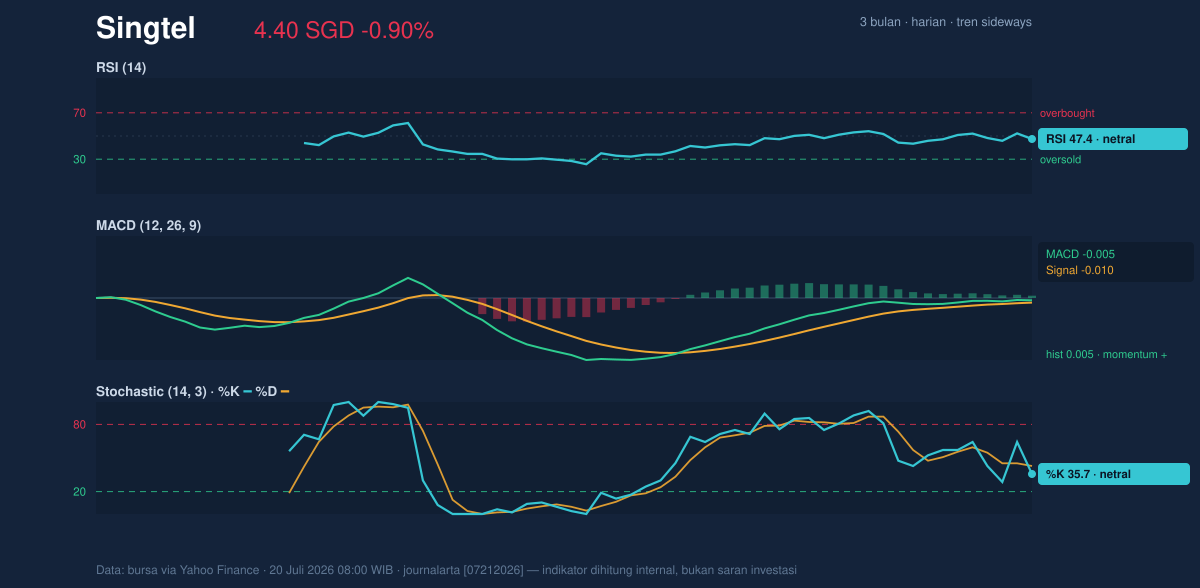
The oscillators tell a story of equilibrium with a faint undertow. The RSI at 47.4 is dead neutral — the Relative Strength Index measures the speed of recent gains versus losses on a 0–100 scale, and readings near 50 signal neither overbought greed nor oversold fear. The Stochastic gauge, which compares the close to its recent range, shows %K at 35.7 trailing %D at 42.9, a mild bearish drift suggesting short-term sellers have the initiative.
Yet the MACD disagrees — quietly. While the MACD line at -0.005 remains below zero, it has crossed above its signal line at -0.010, leaving the histogram positive at +0.005. In plain terms, downward momentum is fading and a nascent recovery is building under the surface, as visible in the momentum chart. When RSI, Stochastic and MACD refuse to align, it is typically the fingerprint of consolidation, not reversal.
Volatility & Volume: A Squeeze Looking for a Catalyst
The most compelling signal is the Bollinger Band squeeze. The bands — volatility envelopes drawn two standard deviations around the 20-day average — have narrowed to a width of just 2.8%, with the price holding a %B reading of 37%, placing it in the lower half of the envelope. Compression of this kind historically precedes expansion: the market is storing energy, though the direction of the eventual release is unknowable in advance. Average True Range, a measure of the stock's typical daily swing, sits at 0.07 SGD or 1.6% of the price — moderate, leaving room for that range to expand.
Volume adds a cautionary note. Turnover of 28.8 million shares ran at 1.1 times the 20-day average on a down day, and on-balance volume is trending down. OBV accumulates volume on up days and subtracts it on down days; its decline implies that participation is quietly favoring the sell side even as the price holds steady — a divergence that undercuts the MACD's optimism.
Key Levels & Conditional Scenarios
The battleground is narrow. Support at 4.35 aligns almost exactly with the lower Bollinger band, forming a double floor; a decisive break below it would resolve the squeeze downward and put the three-month low of 4.15 back in view. Resistance at 4.47 sits just under the upper band at 4.48, so a close above that zone — ideally on rising volume to reverse the OBV decline — would signal an upside breakout, with the 5.05 three-month high as the distant reference point.
Technical Verdict: HOLD (wait & see)
The weight of evidence supports HOLD (wait & see):
- The price trades below both key moving averages with no bullish crossover, so the trend offers no confirmation (trend signal).
- The MACD histogram's positive turn is contradicted by falling OBV — momentum and participation are not aligned (confirmation failure).
- The Bollinger squeeze at 2.8% width means the market itself has not chosen a direction yet (volatility signal).
Verdict invalidated if the price falls decisively below 4.35, which would flip the technical bias bearish and reopen the path toward 4.15.
For those tracking the setup strictly from the data:
- Entry Range: 4.35–4.42 (support to the 20-day average), or only on a confirmed breakout above 4.47–4.48
- Exit Target: 4.47 first, then 4.48 (upper band); extended reference at the 5.05 three-month high if a breakout is confirmed
- Stop Loss: a close below 4.35, the support floor
In plain English: this is a stock in a waiting room, and the most informative position for now is the sidelines — the corridor between 4.35 and 4.47, just 12 cents wide, has contained Singtel's price for a month.
*This is technical analysis based on market data, not an investment recommendation; the site disclaimer applies.*
Summary Data Singtel
| Last price | 4.40 SGD |
| Change 1 day / 5 days / 1 month | -0.90% / -0.68% / 0.92% |
| Trend / MA-cross | sideways / none |
| SMA20 / SMA50 | 4.42 / 4.46 |
| RSI (14) / Stochastic %K | 47.4 / 35.7 |
| Bollinger %B / ATR | 37% / 0.07 |
| Support / Resistance 20 days | 4.35 / 4.47 |
| Data as of | 20 Juli 2026 08:00 WIB |


