RSI Overbought, OCBC Stock Gains 0.46% Today
On Juli 21, 2026: price 28.69 SGD, trend uptrend, RSI 82.6, support 24.66, resistance 28.78. technical analysis of ocbc stock. RSI Overbought — full details…

Shares of Oversea-Chinese Banking Corporation (O39.SI) last changed hands at S$28.69, up 0.46% from the previous close of S$28.56, extending a five-day gain of 4.40% and a one-month advance of 14.76%, data from the Singapore Exchange via Yahoo Finance showed as of 20 July 2026. The move leaves one of Singapore's largest lenders pressing against the ceiling of its recent range, and the technical picture has become a genuine tug-of-war: the trend is emphatically upward, yet nearly every short-term momentum gauge is flashing that the rally has run ahead of itself.
Trend & Price Action
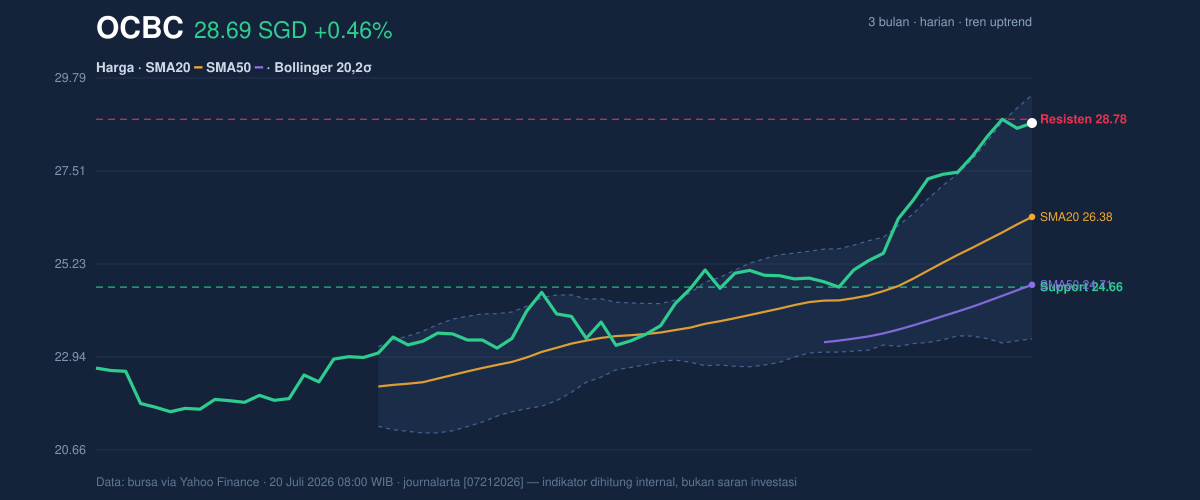
The structure is unambiguously bullish. OCBC trades well above its SMA20 at S$26.38 and its SMA50 at S$24.71, with the 20-day average itself rising at a steep 3.67% per five sessions — evidence that buyers have been consistently willing to pay more, week after week. There is no new moving-average crossover to report, which matters in its own way: the bullish alignment of price above a rising SMA20 above a rising SMA50 is a mature, established trend rather than a fresh signal. Mature trends can persist, but they offer less margin for error than young ones.
What stands out is where the price sits within its own range. At S$28.69, the stock is at 98% of its 20-day range, a whisker below resistance at S$28.78 and within touching distance of the three-month high at S$28.96, as shown in the chart below. The three-month low of S$21.51 now looks distant.
Momentum: Confirmed, but Stretched
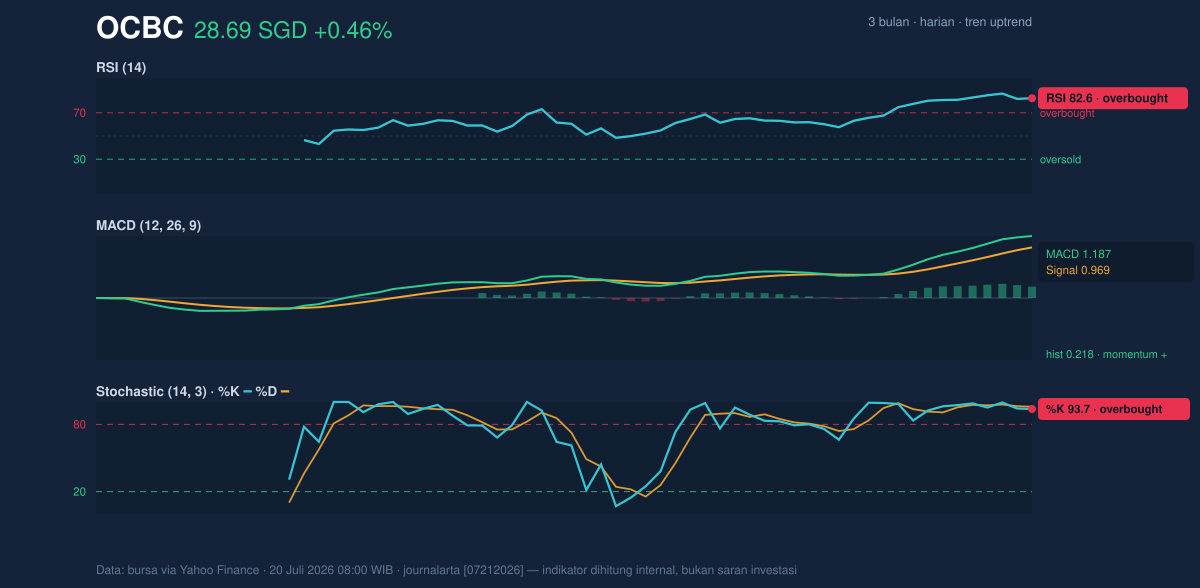
Here the picture splits into two camps. The trend-following gauges confirm the rally: MACD stands at 1.187, above its signal line at 0.969, with a positive and expanding histogram of +0.218. That combination says the upward impulse is still building, not fading.
The mean-reversion gauges, however, are stretched. The RSI(14) at 82.6 is deep in overbought territory — well above the 70 threshold that typically marks an overheated move. Read plainly, it means recent gains have dominated losses to an unusual degree. Overbought is not the same as "about to fall"; strong trends can hold elevated RSI for weeks. But it does compress the reward-to-risk for anyone entering at current levels.
The more nuanced signal comes from the Stochastic, with %K at 93.7 and %D at 95.8. Both are pinned in overbought ground, yet %K has slipped below %D — a small crossover at extreme highs that often serves as the earliest hint that upside momentum is cooling, visible in the momentum chart.
Volatility & Volume
Bollinger Bands are expanding, with bandwidth at 22.7% — a high-volatility regime in which larger daily swings become normal. The %B reading of 88% shows price hugging the upper band at S$29.38, a behaviour technicians call "walking the band." In powerful uptrends this can continue for extended periods, but it also means the stock is priced at the optimistic edge of its own statistical envelope. The ATR of 0.52, or 1.8% of price, confirms moderate day-to-day volatility — enough that a single ordinary session could carry the stock through resistance, or back toward the mid-band.
Volume is the quiet caveat. The latest turnover of 6.02 million shares is only 1.1 times the 20-day average of 5.66 million — steady participation, not a surge of new money. On-balance volume is rising, which signals accumulation rather than distribution, but a decisive breakout would ideally arrive with heavier volume behind it.
Key Levels & Scenarios
The immediate battleground is narrow. If the stock breaks and holds above S$28.78, then S$28.96, the chart opens toward the upper Bollinger Band at S$29.38 and beyond, with the rising trend as tailwind. If it fails at resistance while the Stochastic crossover plays out, the natural magnet is the SMA20 at S$26.38 — a routine mean reversion, not a trend break. Only a slide through the S$24.66–S$24.71 zone, where 20-day support meets the SMA50, would genuinely damage the bullish structure.
Technical Verdict: HOLD
Verdict: HOLD (wait & see) — the trend argues against selling, but the entry math argues against chasing.
- Reason 1: RSI at 82.6 and Stochastic above 93, with %K crossing below %D, mark an overbought market at 98% of its range — historically poor odds for fresh entries.
- Reason 2: The trend itself is intact: price above rising SMA20/SMA50, MACD histogram positive and expanding at +0.218, OBV rising. There is no technical sell signal to act against.
- Reason 3: Price sits directly beneath unconfirmed resistance at S$28.78–S$28.96, where breakouts either prove themselves or fail.
- Invalidation: this wait-and-see stance weakens if the price falls below S$26.38 (SMA20); it upgrades to constructive on a confirmed close above S$28.96.
Level framework, drawn strictly from the data:
- Entry Range: a pullback toward the SMA20 at S$26.38; momentum-style entries only on a confirmed break above S$28.96
- Exit Target: the upper Bollinger Band at S$29.38
- Stop Loss protection: a daily close below S$24.66, the 20-day support
In plain English: the shares are in a strong climb but look overheated right under a ceiling, so the technical evidence favours patience over pursuit. The next checkpoint arrives with the stock's test of S$28.78–S$28.96 in the sessions ahead — the level that will decide whether this rally extends or pauses. This is technical analysis based on market data, not an investment recommendation; the site disclaimer applies.
Summary Data OCBC
| Last price | 28.69 SGD |
| Change 1 day / 5 days / 1 month | 0.46% / 4.40% / 14.76% |
| Trend / MA-cross | uptrend / none |
| SMA20 / SMA50 | 26.38 / 24.71 |
| RSI (14) / Stochastic %K | 82.6 / 93.7 |
| Bollinger %B / ATR | 88% / 0.52 |
| Support / Resistance 20 days | 24.66 / 28.78 |
| Data as of | 20 Juli 2026 08:00 WIB |


