HSBC Stock Technicals Today: Gains 0.57%, RSI Overbought
On Juli 21, 2026: price 157.80 HKD, trend uptrend, RSI 70.1, support 147.60, resistance 156.90. technical analysis of hsbc stock. HSBC Stock Technicals — full…

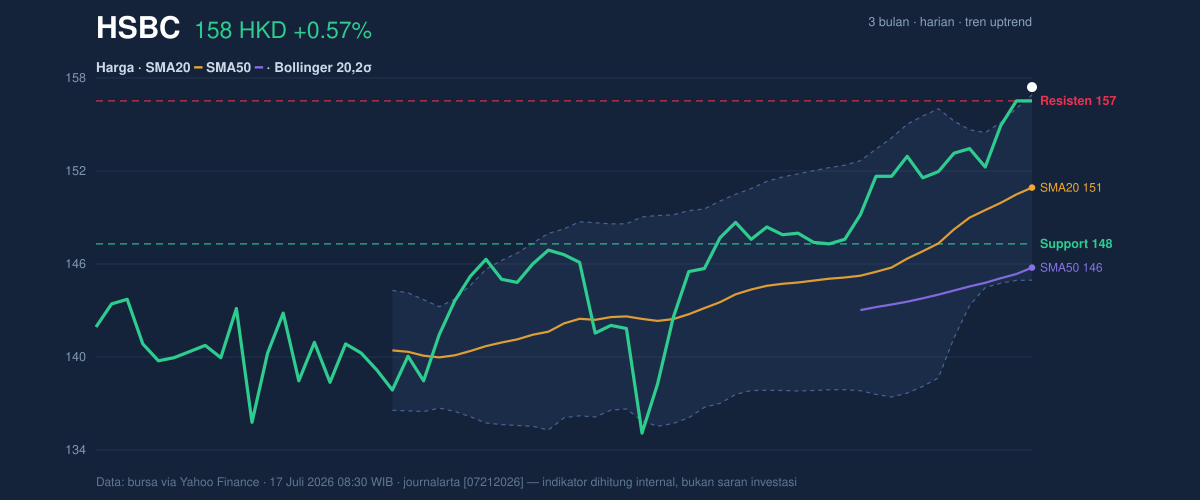
HSBC Holdings closed at HK$157.80 on the Hong Kong exchange on 17 July, up 0.57% on the day and 6.62% over the past month, according to bourse data via Yahoo Finance. The number that matters, though, is not the daily gain: the stock finished above both its 20-day resistance at HK$156.90 and the upper Bollinger Band at HK$157.29, leaving it just HK$0.60 below the three-month high of HK$158.40. The setup now hinges on a simple question — is this a genuine breakout from a compressed trading range, or an overbought stretch running straight into a ceiling?
Trend & Price Action
The underlying structure is unambiguously bullish. The share price sits above a rising 20-day simple moving average at HK$151.26 — sloping up at 1.83% every five sessions — and comfortably above the 50-day average at HK$146.06. No fresh moving-average crossover has fired, but none is needed: the alignment has been positive for weeks.
What makes this moment distinct is the volatility picture. The Bollinger Band width has narrowed to just 8.0%, a condition technicians call a squeeze — a period of unusually quiet trading that historically precedes a sharp expansion in either direction. This squeeze is resolving upward. With %B at 104%, meaning the price sits 4% beyond the upper band, and the stock at 110% of its own 20-day range, buyers have forced the issue.
That is strength. It is also stretch.
Oscillators & Momentum
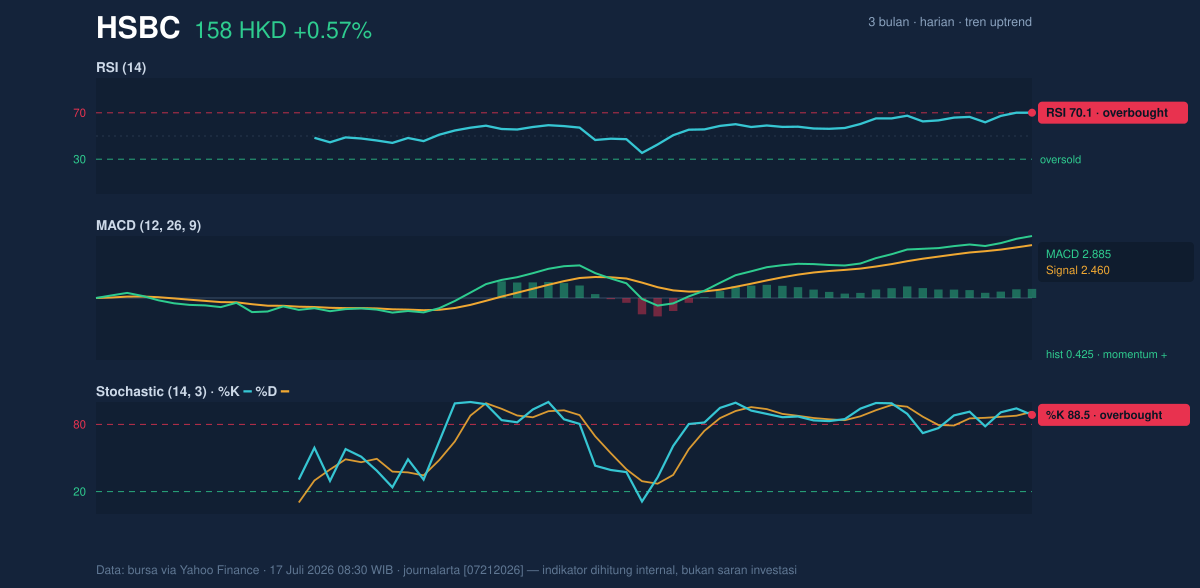
Momentum gauges confirm the trend but flash amber on timing. The 14-day RSI stands at 70.1, just over the 70 threshold that marks an asset as overbought — a signal that recent gains have been fast enough to make further immediate upside harder work. The Stochastic is more emphatic: %K at 88.5 has slipped below %D at 91.2, a small bearish crossover deep in overbought territory that often precedes a cooling period.
The MACD tells the opposite story about the bigger move. At 2.885 versus a signal line of 2.460, with a positive histogram of 0.425, trend momentum is still accelerating rather than fading. Read together: the engine is fine, but the throttle is hot.
Volatility & Volume
Average true range — the typical daily swing — sits at HK$2.64, or 1.7% of the price. That is moderate volatility, and it means the remaining distance to the three-month high is well within one normal session's travel.
Volume backs the move without confirming it outright. The last session printed 17.65 million shares against a 20-day average of 14.42 million — 1.2 times normal — while on-balance volume, a running tally of buying versus selling pressure, continues to rise. Participation is real. It is not yet emphatic.
Key Levels & Scenarios
Three prices now define the board. Above, HK$158.40 is the three-month high and the final chart barrier in the current data; a daily close above it would validate the squeeze breakout. At HK$156.90, the former resistance becomes the pivot — holding above it keeps the breakout intact, while slipping back below would mark a failed break and open a path toward the HK$151.26 moving average. Below that, the 20-day support at HK$147.60 and the lower Bollinger Band at HK$145.24 form the last line of the current structure.
Technical Verdict: HOLD
The technical verdict is HOLD (wait & see). Three reasons dominate: the trend and MACD remain firmly bullish, arguing against exiting; but RSI at 70.1, Stochastic %D at 91.2 and %B at 104% — all at the HK$158.40 ceiling — make chasing the rally poor risk-reward; and volume at only 1.2 times average has not yet proven a decisive break. The verdict is invalidated if the price falls below HK$151.26, which would damage the trend structure; a close above HK$158.40 would upgrade the picture.
- Entry Range: HK$151.30–156.90, on a pullback toward the 20-day average or a retest of the breakout pivot
- Exit Target: HK$158.40, the three-month high
- Stop Loss: a daily close below HK$147.60, under the 20-day support
In plain terms: the trend is up, but the stock is sprinting directly beneath a ceiling, so patience beats pursuit here. This is technical analysis, not an investment recommendation.
The gap to the breakout test is HK$0.60 — less than a quarter of the HK$2.64 average daily range.
Summary Data HSBC
| Last price | 157.80 HKD |
| Change 1 day / 5 days / 1 month | 0.57% / 2.80% / 6.62% |
| Trend / MA-cross | uptrend / none |
| SMA20 / SMA50 | 151.26 / 146.06 |
| RSI (14) / Stochastic %K | 70.1 / 88.5 |
| Bollinger %B / ATR | 104% / 2.64 |
| Support / Resistance 20 days | 147.60 / 156.90 |
| Data as of | 17 Juli 2026 08:30 WIB |



