AMD Stock Analysis: Gains 8.11%, Momentum Weakens
On Juli 22, 2026: price 544.43 USD, trend sideways, RSI 54.9, support 495.76, resistance 580.91. technical analysis of amd stock. AMD Stock Analysis — full…

AMD is trading in a middle-to-upper position within its recent range, but the tape still looks more like consolidation than a clean breakout, and that matters for international investors watching U.S. chip stocks as a proxy for risk appetite. Shares last changed hands at 544.43 USD, up 8.11% on the day from a prior close of 503.57, yet the broader pattern remains sideways rather than decisively trending.
Trend & Price Action
The first signal is simple: price is holding above the SMA20 at 530.97 and also well above the SMA50 at 503.45. That usually tells traders the medium-term structure has not broken down, even if the stock is not accelerating higher. The absence of a new MA-cross suggests the moving-average picture has not delivered a fresh trend confirmation, so the market is still deciding whether the recent strength is the start of something larger or just another swing inside a broad range.
As shown in the chart, AMD is also sitting at about 57% of its 20-hour range, with support at 495.76 and resistance at 580.91. That placement is important because it shows the stock is not stretched at the top of the range, but neither is it near the lower boundary where bargain-hunting typically intensifies. The 3-month band reinforces the same message: the shares are trading far below the 3-month high of 584.73, but also far above the 3-month low of 286.14. In other words, the market has recovered a lot of ground, yet it has not proven that the recovery is complete.
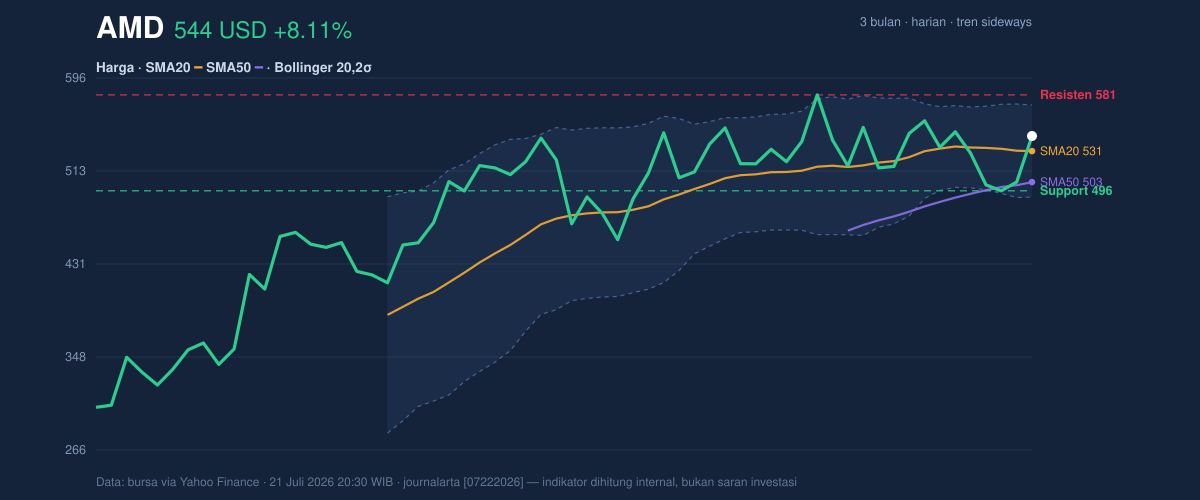
The SMA20 slope of -0.77% over 5 days is a subtle warning. A falling short-term average means the recent momentum has been soft even while price sits above it, and that kind of setup often precedes either a pause or a sharper move once the range resolves.
Oscillators & Momentum
The momentum indicators are mixed rather than aligned. The RSI at 54.9 is neutral, which means AMD is neither overbought nor oversold. That is not a bullish or bearish signal by itself; it tells readers the stock still has room to move in either direction without immediately hitting an exhaustion zone. The Stochastic %K at 73.9 and %D at 45.8 leans firmer in the short term, but the gap between the two lines suggests the move has not fully matured into a confirmed momentum breakout.
The more cautionary read comes from the trend-following oscillator. The MACD at 5.952 sits below the signal line at 11.090, leaving a histogram of -5.137. That negative histogram means upside momentum is currently lagging the trend signal, so the stock may be rising on price structure and participation, but not yet on fully synchronized internal momentum. As shown in the chart, that kind of divergence often appears when a rally is trying to reassert itself after a period of hesitation.
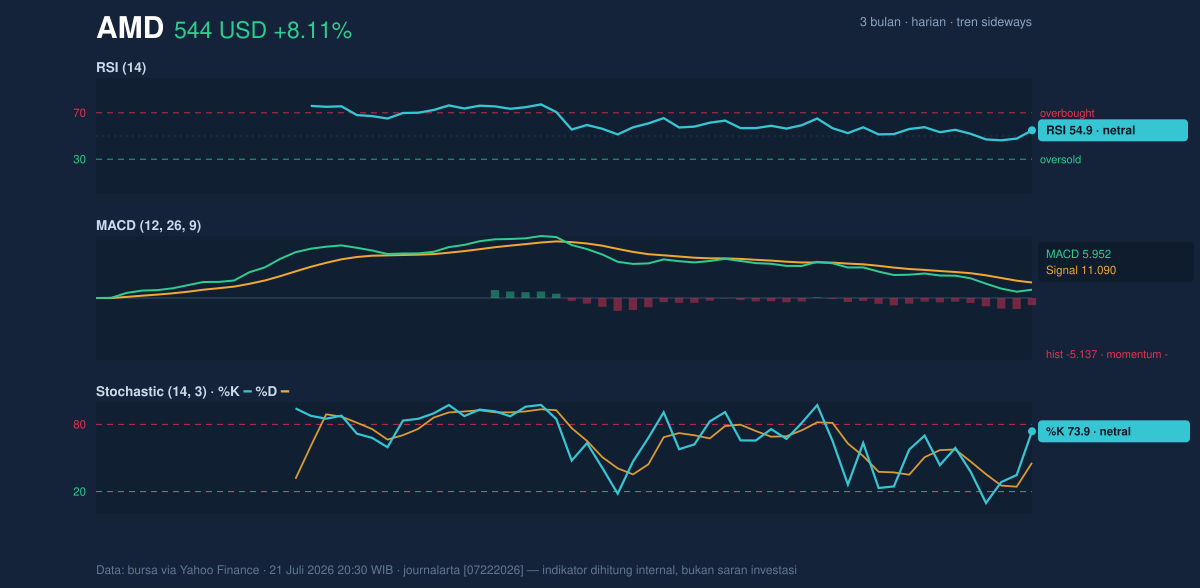
For a general reader, the message is straightforward: AMD is not showing panic, but it is also not showing a strong, clean momentum thrust. The oscillators say “stable,” while MACD says “not yet convincing.”
Volatility & Volume
Volatility is elevated. The ATR(14) at 39.21, equal to 7.2% of price, signals that daily swings can be wide. That matters because a stock can look calm on a chart and still move sharply in either direction once it breaks out of the current band. The Bollinger Bands help frame that risk: the upper band is 571.92, the middle band is 530.97, and the lower band is 490.02. With %B at 66% and band width at 15.4%, AMD is sitting above the middle of the envelope but not pressing the upper edge. That points to a normal, not compressed, volatility regime — enough room for movement, but no strong squeeze that would usually precede a sudden expansion.
Volume adds a modest confirmation. Last volume was 28,967,100 against a 20-hour average of 28,446,875, or roughly 1.0× normal. That is not the kind of surge that screams institutional breakout, but it does show the day’s advance was not taking place on thin participation. The OBV is rising, which is constructive because on-balance volume tracks whether money flow is quietly accumulating. Rising OBV alongside price above key averages suggests buyers are still present, even if they have not yet forced a decisive trend change.
Key Levels & Scenarios
The immediate map is clear. Resistance at 580.91 is the first ceiling to watch, and it sits just under the 3-month high of 584.73, making that zone especially important. If AMD can push through that area, the chart would begin to challenge the current sideways label. On the downside, support at 495.76 is the first line where the market has previously attracted demand, and a break below it would weaken the case that the stock is building a base above the SMA50 at 503.45.
The most useful way to read the setup is conditional. If price remains above the SMA20 at 530.97 and continues to hold rising volume, the market is likely still testing the upper half of the range. If it loses 495.76, the tone changes quickly because the stock would be slipping back toward the mid-500s structure that has supported the recent rebound.
Technical Verdict: HOLD (wait & see)
HOLD (wait & see)
- RSI 54.9 is neutral, so there is no strong overbought or oversold signal to justify an aggressive directional read.
- MACD histogram -5.137 shows momentum is still negative even though price is above the SMA20 530.97.
- OBV rising and price above the SMA50 503.45 keep the structure constructive, but the sideways trend and lack of a new MA-cross argue for patience.
- Entry Range: 530.97 to 495.76
- Exit Target: 571.92 to 580.91
- Stop Loss protection: below 495.76
Verdict invalidated if price breaks below 495.76.
For non-traders, that means AMD is holding up, but the chart has not yet proven that the next move is clearly up. “We’re not in trouble, but we’re not out of the woods either,” one trader might say.
Summary Data AMD
| Last price | 544.43 USD |
| Change 1 day / 5 days / 1 month | 8.11% / -0.68% / -1.31% |
| Trend / MA-cross | sideways / none |
| SMA20 / SMA50 | 530.97 / 503.45 |
| RSI (14) / Stochastic %K | 54.9 / 73.9 |
| Bollinger %B / ATR | 66% / 39.21 |
| Support / Resistance 20 days | 495.76 / 580.91 |
| Data as of | 21 Juli 2026 20:30 WIB |


