ORCL Stock Analysis: Gains 4.67%, Momentum Weakens
On Juli 22, 2026: price 127.05 USD, trend downtrend, RSI 32.7, support 121.38, resistance 165.16. technical analysis of orcl stock. ORCL Stock Analysis — full…

Oracle’s latest move matters far beyond Wall Street: the software giant is trying to stabilise after a steep slide, but the chart still says sellers have the upper hand.
Oracle shares on the NYSE closed at 127.05 USD, up 4.67% on the day, according to Yahoo Finance data cited at 21 July 2026 20:30 WIB. That bounce came after a weak stretch: the stock is still down 0.70% over five days and 27.43% over one month. The gap between a one-day rebound and a one-month drop is important. It suggests the latest gain may be a relief move inside a broader de-rating, not yet a confirmed turn in trend.
Trend & Price Action
The bigger picture remains firmly negative. Oracle is trading below the 20-day SMA at 140.12 and far under the 50-day SMA at 175.86, with the SMA20 slope down 9.45% over five days. In plain language, that means the short-term average is still falling quickly, so the recent price bounce is happening against the direction of travel. There is also no fresh moving-average crossover, which matters because crossovers often mark a shift in trend momentum; without one, the market has not yet signalled a durable reversal.
The price is also sitting low in its recent range. Support over 20 hours is 121.38, resistance is 165.16, and Oracle is positioned at about 13% of that range. That tells traders the stock is still closer to the lower end of the band than the middle, even after the rebound.
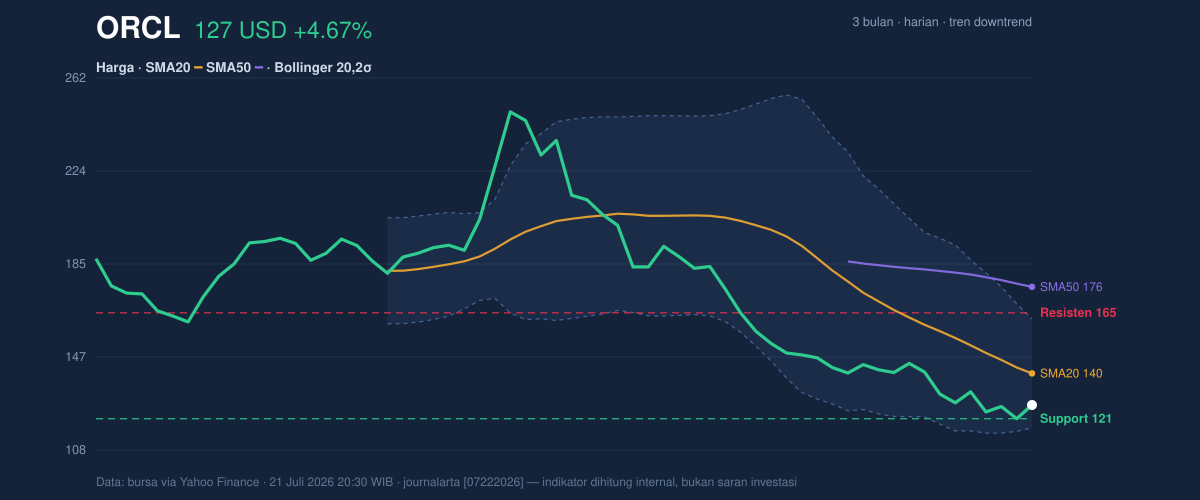
The three-month range sharpens the picture: the stock’s 3-month high is 250.25 and its 3-month low is 120.03. Oracle is now trading just above that low, which shows how much of the prior uptrend has already been unwound.
That is not a healthy backdrop for complacency.
Oscillators & Momentum
The momentum tools are mixed, but not in a way that yet confirms a recovery. The RSI(14) at 32.7 is described as neutral, but it is close to the oversold zone that often appears when selling has been extended. In practical terms, that means the stock has been weak enough to attract bargain-hunting, but not weak enough to prove exhaustion. The Stochastic %K at 24.2 and %D at 14.5 are also labelled neutral, though both are low enough to suggest price is near the lower part of its recent cycle. That can support a bounce, but only if price starts to hold higher levels.
The more telling signal is the MACD at -14.952, below the signal line at -14.876, with a histogram of -0.076. MACD compares short- and medium-term price momentum; when it sits below the signal line, it suggests downside pressure still dominates. The histogram being negative, even slightly, means that bearish momentum has not fully faded.
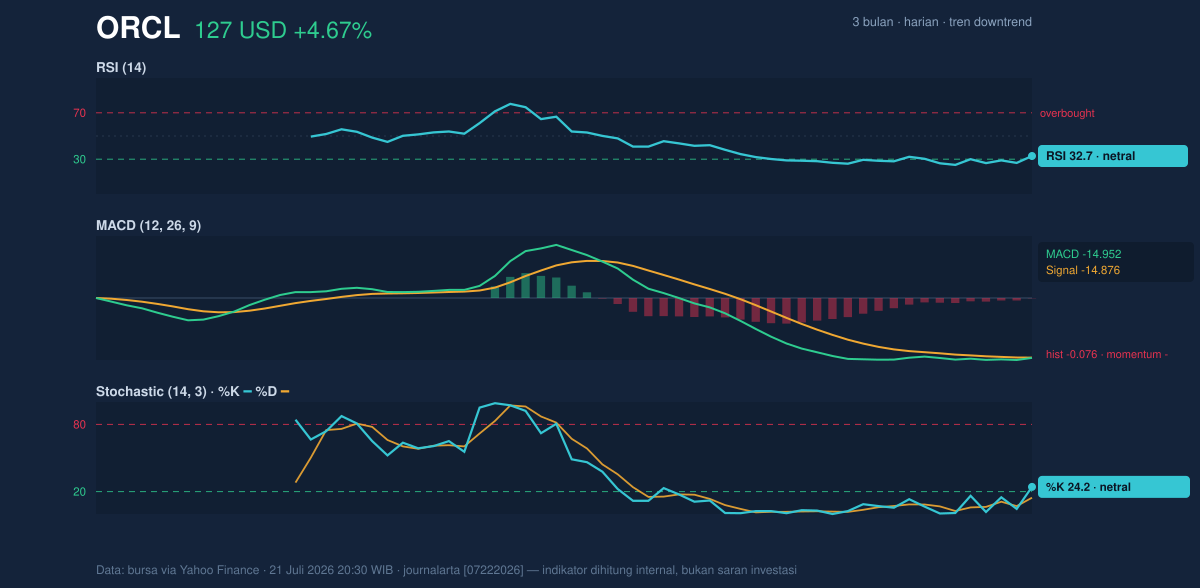
So while oscillators are no longer screamingly weak, they are not yet aligned with a bullish turn. The market is in the awkward middle stage where the selling may be slowing, but buyers have not taken control.
Volatility & Volume
Volatility remains elevated. Oracle’s ATR(14) is 6.75, or 5.3% of price, which means the stock is still capable of fairly wide daily moves. The Bollinger Bands reinforce that message: the upper band is 162.64, the middle band is 140.12, and the lower band is 117.61, with %B at 21% and band width at 32.1%. A low %B means price is sitting near the lower part of the band structure, often a sign of pressure rather than strength; the wider band width says volatility is expanding, not compressing. In other words, the stock is not coiling quietly — it is still moving in a stressed regime.
Volume does not yet provide convincing confirmation for the rebound. Last volume was 27,596,900, below the 20-hour average of 40,295,100, or about 0.7× normal. That matters because a price rise on lighter trading can be less dependable than one backed by broad participation. The OBV is falling, which is another warning sign: on-balance volume tracks whether money flow is accumulating or leaving the stock, and a declining OBV says distribution remains the dominant pattern.
The bounce, in short, has not yet earned trust.
Key Levels & Scenarios
The market is now focused on whether Oracle can defend the lower end of the recent band. The first line to watch is the 121.38 support, which also matches the recent 20-hour support and sits just above the 3-month low of 120.03. If that area fails, the stock would be vulnerable to another leg lower because there is little technical cushion beneath it in the data provided.
On the upside, the nearest checkpoints are the 140.12 SMA20 and then 162.64 at the upper Bollinger Band, before the 165.16 resistance. A move back above the 20-day average would matter because it would show price has reclaimed a short-term trend marker, not just bounced from an oversold pocket. A push toward the upper band would signal stronger mean reversion, but it would still need to clear resistance to suggest a broader repair.
Technical Verdict: HOLD (wait & see)
HOLD (wait & see) because the stock is still below both major moving averages, MACD remains negative, and OBV is falling, even though RSI and Stochastic are near lower levels that can support a rebound. The latest rally is real, but it is not yet confirmed by trend or volume.
- Ideal Entry Range: 121.38 to 127.05, where support and the current price sit close together.
- Exit Target: 140.12 first, then 162.64 if momentum improves and the upper band comes into play.
- Stop Loss protection: below 120.03, the 3-month low, because that would weaken the current support structure.
- Verdict invalidated if price falls below 120.03, as that would signal the lower range has failed.
For non-traders, this means Oracle’s share price has stopped falling hard for the moment, but the chart has not yet shown that the decline is over.
“I’m watching whether 121.38 holds — if it doesn’t, the market will be telling a much harsher story.”
Summary Data ORCL
| Last price | 127.05 USD |
| Change 1 day / 5 days / 1 month | 4.67% / -0.70% / -27.43% |
| Trend / MA-cross | downtrend / none |
| SMA20 / SMA50 | 140.12 / 175.86 |
| RSI (14) / Stochastic %K | 32.7 / 24.2 |
| Bollinger %B / ATR | 21% / 6.75 |
| Support / Resistance 20 days | 121.38 / 165.16 |
| Data as of | 21 Juli 2026 20:30 WIB |

