INTC Stock Gains 8.64%, Death Cross Pressure In Focus
On Juli 22, 2026: price 105.45 USD, trend downtrend, RSI 45.8, support 95.04, resistance 139.63. technical analysis of intc stock. INTC Stock Gains — full…

Intel is still trading in the damage zone for international investors: the shares bounced sharply in the latest session, but the broader chart remains under pressure, with the stock below both key moving averages and momentum still negative.
Intel closed at 105.45 USD, up 8.64% on the day from a previous close of 97.06, according to Yahoo Finance data as of 21 July 2026 20:30 WIB. That rebound matters, but it does not erase the larger picture. The stock is still down 25.18% over one month, and the trend remains a downtrend with the SMA20 at 115.87 and the SMA50 at 116.86, while price stays below both. In plain terms, the market is still pricing Intel below its recent average behavior, which usually signals that rallies are being treated as recovery attempts rather than confirmed reversals.
Trend & Price Action
The chart shows a stock that is trying to stabilize, but not yet proving it can reclaim control.
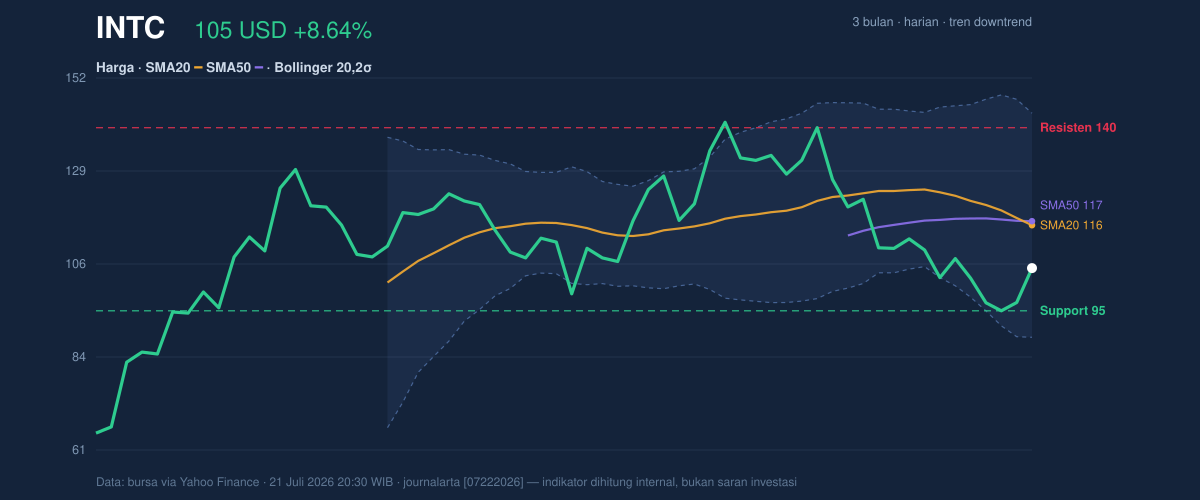
The most important structural signal is the death cross, where the SMA20 has crossed below the SMA50. That pattern often tells traders that short-term weakness has become embedded in the medium-term trend. The slope of the SMA20 at -5.83% over 5 days reinforces that message: the average price itself is still falling, so the recent bounce needs follow-through before it can be called more than a reflex move.
Intel is also sitting in the lower part of its recent range. The 20-hour support at 95.04 and 20-hour resistance at 139.63 frame a wide band, and the current price is positioned at about 23% of that range. That means the stock is closer to the lower end than the upper end, but not yet at the floor. The 3-month low of 64.98 is far below current levels, while the 3-month high of 142.35 sits just above the resistance zone, showing how much ground Intel has lost since its stronger phase.
Oscillators & Momentum
Momentum is not broken enough to call oversold, but it is still weak enough to warn against assuming the bounce is self-sustaining.
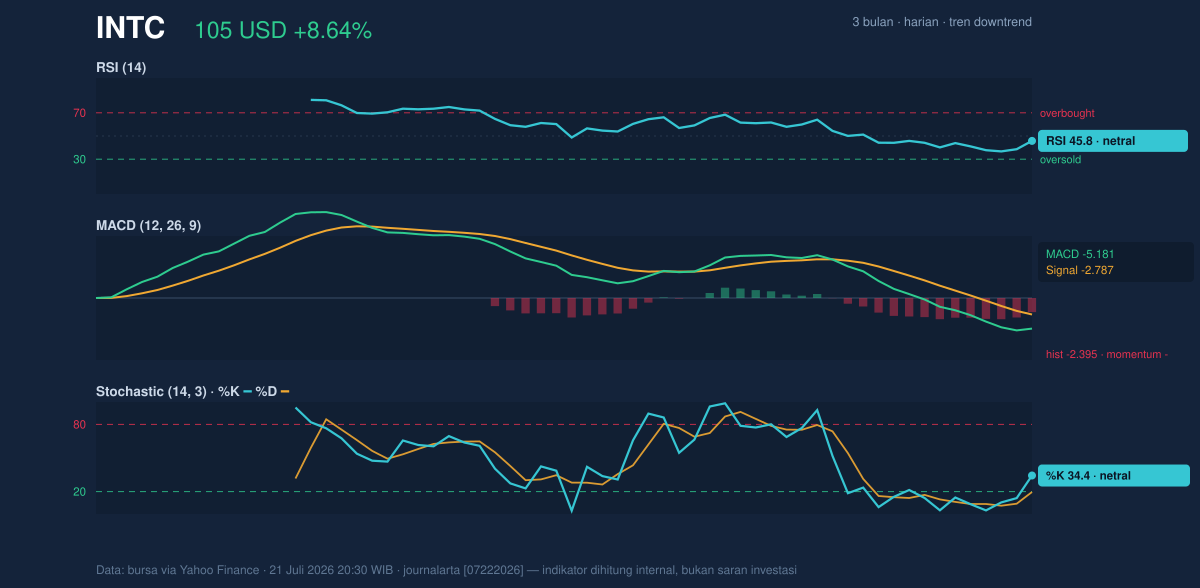
The RSI(14) at 45.8 is neutral. That matters because RSI is not flashing panic, but it also is not showing strong buying pressure. The Stochastic %K at 34.4 and %D at 19.6 are also neutral, with the faster line above the slower one, which can hint at a short-term lift, yet the signal is still modest rather than decisive.
The more important reading comes from the MACD at -5.181, below its signal line at -2.787, with a histogram of -2.395. In simple terms, MACD is measuring trend momentum, and a negative histogram means downside force is still stronger than the rebound attempt. That is why the day’s jump should be treated as a countertrend move unless momentum improves further.
Volatility & Volume
Intel’s chart is moving with unusually wide swings, which raises the odds of sharp moves in either direction.
The Bollinger Bands are stretched, with the upper band at 143.15, the middle at 115.87, and the lower at 88.60. The %B at 31% shows price is in the lower half of the band structure, but not yet pressed against the lower edge. More importantly, the 47.1% band width indicates the bands are expanding, a sign of high volatility. When volatility expands during a downtrend, it often means the market is still searching for a stable price rather than building a calm base.
The ATR(14) at 8.60, equal to 8.2% of price, confirms that daily swings remain elevated. That is important because a move of this size can quickly turn a one-day rebound into either a genuine recovery start or a failed bounce. Volume at 104,960,600 was close to the 20-hour average of 108,306,510, or 1.0x normal, so the latest rise was not backed by a clear surge in participation. The OBV is down, which means volume flow has not yet convincingly turned in Intel’s favor. In market terms, price is trying to rise, but the accumulation signal is still absent.
Key Levels & Scenarios
The key battle zone is between 95.04 support and 115.87 resistance, with a broader ceiling at 139.63. If Intel can reclaim the 115.87 area, that would be the first sign that the stock is moving back toward its short-term average and attempting to repair the damage from the death cross. If it fails there, the chart remains trapped in a bearish structure.
The lower boundary matters just as much. A break below 95.04 would expose the stock to a deeper test of the lower Bollinger band at 88.60, which is the next technical reference for a downside extension. Because the bands are wide and ATR is high, either level could be reached quickly if selling resumes.
Technical Verdict: HOLD (wait & see)
HOLD (wait & see)
- Death cross and price below SMA20 115.87 / SMA50 116.86 keep the trend bearish.
- MACD remains negative, showing downside momentum is still stronger than the rebound.
- RSI 45.8 and Stochastic 34.4 / 19.6 are neutral, so the bounce is not yet confirmed.
- Verdict invalidated if price breaks below 95.04, because that would weaken the current support base and raise the odds of a move toward 88.60.
- Ideal Entry Range: 95.04 to 105.45, where support and the current price zone overlap.
- Exit Target: 115.87, with 139.63 as the stronger resistance ceiling if momentum improves.
- Stop Loss protection: below 88.60, aligned with the lower Bollinger band.
For non-traders, this means Intel has bounced, but the chart still needs to prove the rebound is real before the trend can be trusted.
Summary Data INTC
| Last price | 105.45 USD |
| Change 1 day / 5 days / 1 month | 8.64% / -2.14% / -25.18% |
| Trend / MA-cross | downtrend / death |
| SMA20 / SMA50 | 115.87 / 116.86 |
| RSI (14) / Stochastic %K | 45.8 / 34.4 |
| Bollinger %B / ATR | 31% / 8.60 |
| Support / Resistance 20 days | 95.04 / 139.63 |
| Data as of | 21 Juli 2026 20:30 WIB |


