AstraZeneca Stock Drops 0.81% Today, Death Cross Pressure
On Juli 22, 2026: price 12,492.00 GBp, trend downtrend, RSI 34.0, support 12,364.00, resistance 14,538.00. technical analysis of astrazeneca stock.

AstraZeneca’s LSE-listed shares fell to 12,492.00 GBp by 20 July 2026 at 14:00 WIB, a move that keeps the stock pinned well below its short- and medium-term trend lines and leaves it trading near the lower end of its recent band, according to Yahoo Finance data via the exchange feed. The message from the chart is not subtle: sellers still control the tape, but the stock is now close enough to nearby support that the next move will say more about whether the decline is merely stretched or still gathering force.
Trend & Price Action
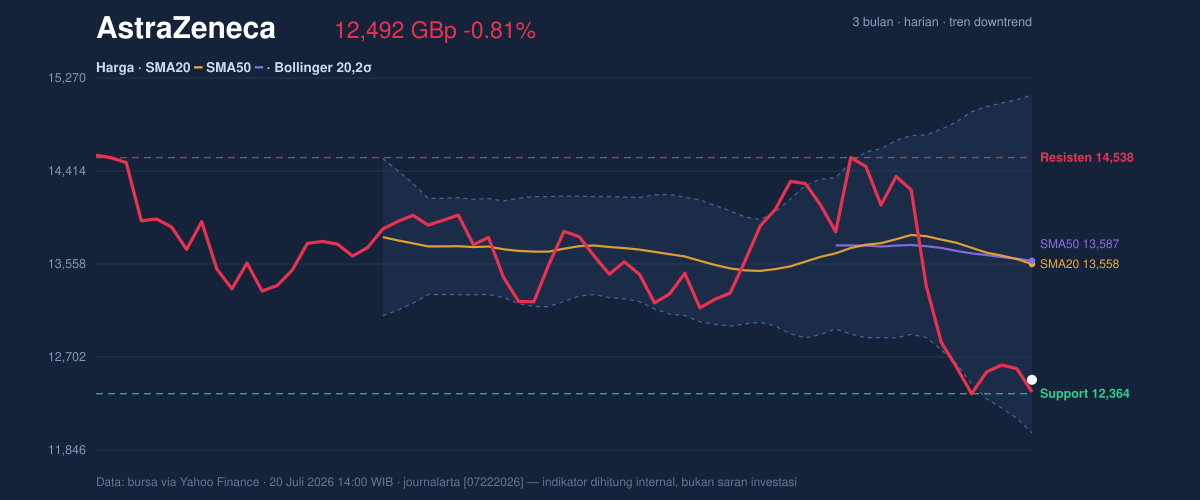
The price sits below the SMA20 at 13,558.00 and below the SMA50 at 13,587.32, which matters because moving averages are a quick read on where the market has been willing to transact most recently. When both are overhead and the shorter average has crossed beneath the longer one, the chart is describing a market that has lost intermediate momentum rather than just having a bad day. That is reinforced by the death cross already in place and by the SMA20 slope of -1.42% over 5 days, which shows the short-term trend is still pointing down.
The stock’s recent performance also fits that structure. It is down 0.81% on the day, 0.94% over 5 days and 6.00% over 1 month, so the weakness is persistent rather than abrupt. As shown in the chart, the price is only 6% of the way through the 20-hour range, which places it near the lower edge of the current trading corridor. That positioning usually means the market is waiting for either a support test to hold, or for a break that invites another leg lower.
Oscillators & Momentum
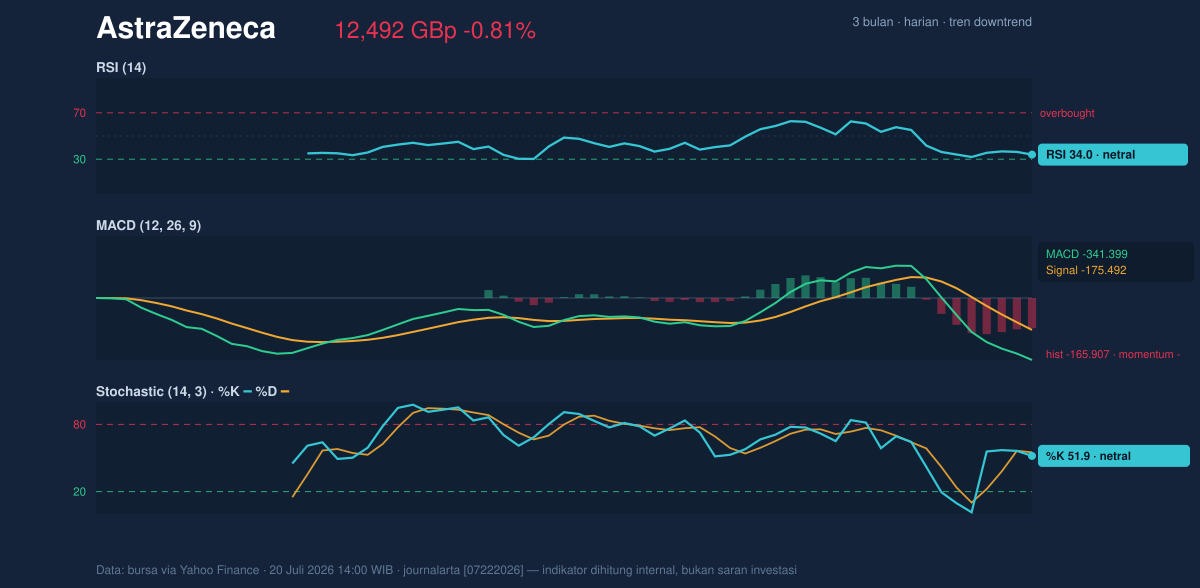
The oscillators are not screaming panic, but they are not offering much relief either. RSI(14) at 34.0 sits just above the oversold threshold, which suggests selling pressure has been heavy enough to drain momentum without yet reaching a classic capitulation reading. In plain English, the stock is weak, but not so weak that the market has clearly exhausted itself.
The Stochastic %K at 51.9 and %D at 55.1 are neutral, which tells a different story from RSI: short-term momentum is not stretched on that measure, and there is no clean rebound signal yet. The more important read, though, comes from MACD. With MACD at -341.399, below the signal line at -175.492, and a histogram of -165.907, the trend-following indicator is still leaning negative. That gap means downside momentum remains active, even if the stock has already fallen enough to look technically tired. As shown in the chart, the oscillators are aligned more with caution than with reversal.
Volatility & Volume
Volatility is elevated, and that changes how the chart should be read. The Bollinger Bands are wide, with the upper band at 15,114.72, the middle band at 13,558.00 and the lower band at 12,001.28. A %B reading of 16% shows the price is sitting close to the lower band, which often signals stress on the downside and can sometimes precede a technical bounce. But that interpretation needs confirmation, because a low %B can also persist during strong downtrends.
The Bollinger band width of 23.0% points to an expanding range, not a quiet consolidation. That matters because expanding bands usually accompany larger moves, not smaller ones. The ATR(14) of 695.29, equal to 5.6% of price, confirms the stock is capable of moving sharply in either direction. Volume does not yet validate a reversal: the latest turnover of 1,718,968 is only 0.7× normal versus the 20-hour average of 2,536,556, while OBV is falling. That combination says participation has not surged behind the latest move, but the balance of traded volume still favors sellers.
Key Levels & Scenarios
The most immediate line in the sand is support at 12,364.00. That level matters because it sits just above the lower Bollinger band at 12,001.28, so a failure there would expose the chart to a deeper test of the band floor and possibly beyond. On the upside, resistance at 14,538.00 is the first clear barrier, and it sits below the 3-month high of 15,126.00. That means any recovery would still need to climb through a substantial overhead supply zone before the trend could be considered repaired.
The 3-month range itself tells the broader story: the stock has traded between 15,126.00 and 9,892.00, and the current price is much closer to the lower half of that span. If 12,364.00 gives way, the chart would be signaling that the market is no longer merely weak but is willing to reprice toward the lower end of the broader range. If that support holds, the first technical repair would still be modest unless price can reclaim the SMA20 at 13,558.00, which is also the Bollinger midline.
Technical Verdict: HOLD (wait & see)
HOLD (wait & see) because the chart is still negative, but the stock is also trading near support and near the lower Bollinger band, where downside can become temporarily overextended. MACD remains negative, OBV is declining, and the death cross keeps the broader technical bias weak. At the same time, RSI at 34.0 and %B at 16% suggest the move is stretched enough that a stabilisation attempt is plausible if support holds.
- Ideal Entry Range: 12,364.00 to 12,001.28, only if price stabilises around support and the lower Bollinger band
- Exit Target (Target Price): 13,558.00 first, then 14,538.00 if the rebound extends to resistance
- Stop Loss protection: below 12,001.28, as a break there would put the lower band and support structure under pressure
The verdict is invalidated if price breaks below 12,001.28.
In plain English: the stock looks weak, but it is close enough to support that the next move will decide whether sellers stay in charge or the chart tries to steady itself.
Volume terakhir: 1,718,968 shares, versus rata-rata 20 jam 2,536,556.
Summary Data AstraZeneca
| Last price | 12,492.00 GBp |
| Change 1 day / 5 days / 1 month | -0.81% / -0.94% / -6.00% |
| Trend / MA-cross | downtrend / death |
| SMA20 / SMA50 | 13,558.00 / 13,587.32 |
| RSI (14) / Stochastic %K | 34.0 / 51.9 |
| Bollinger %B / ATR | 16% / 695.29 |
| Support / Resistance 20 days | 12,364.00 / 14,538.00 |
| Data as of | 20 Juli 2026 14:00 WIB |


