Testing Key Resistance, UNH Stock Gains 3.51% Today
On Juli 22, 2026: price 436.35 USD, trend uptrend, RSI 62.3, support 405.80, resistance 436.35. technical analysis of unh stock. Testing Key Resistance — full…

UnitedHealth Group shares rose to 436.35 on the NYSE, up from a previous close of 421.55, as the stock pushed to the top of its recent trading range in New York. The move is notable not just for the gain itself. It matters because the price is now pressing against the upper Bollinger Band, a sign that momentum is strong but also that the stock is stretched in the short term.
Trend & Price Action
The broader picture remains constructive. UNH is in an uptrend, with the SMA20 rising at 1.20% over 5 days, and the share price sitting above the SMA20 at 422.70 and well above the SMA50 at 405.30. That relationship usually signals that buyers still control the trend, even if the move has become extended. There is no new MA-cross, which means the market is not getting a fresh trend signal from moving averages; instead, it is working off the strength already built into the chart.
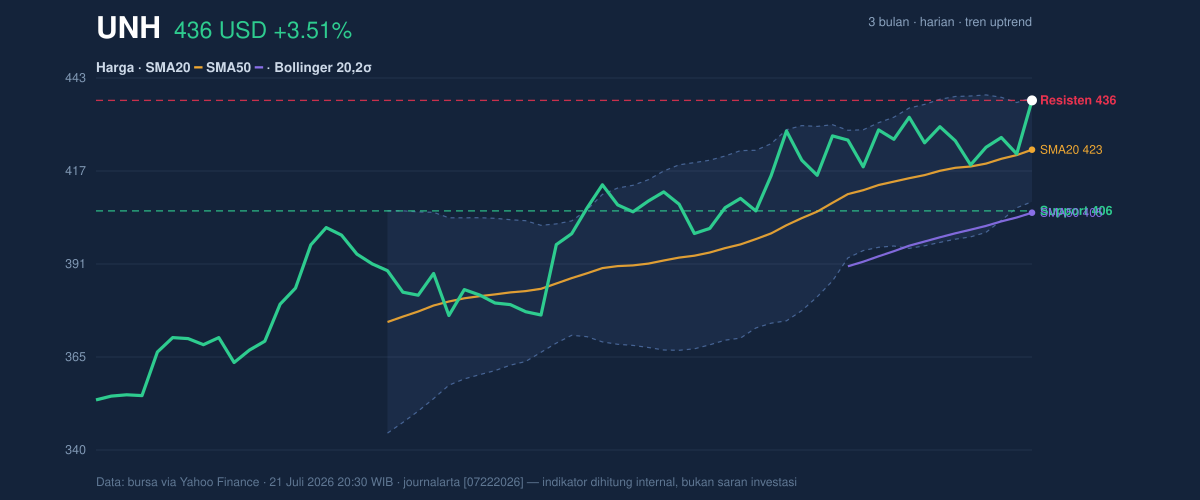
The stock’s position in the range is also important. The latest print sits at 100% of the 20-day range, with 20-day resistance at 436.35 and support at 405.80. In plain language, UNH is trading at the ceiling of its short-term range rather than in the middle of it. That often leaves less room for immediate upside unless the stock can convert resistance into support. The 3-month high of 461.62 remains the next reference point above, while 348.95 marks the lower end of the broader recent band.
Oscillators & Momentum
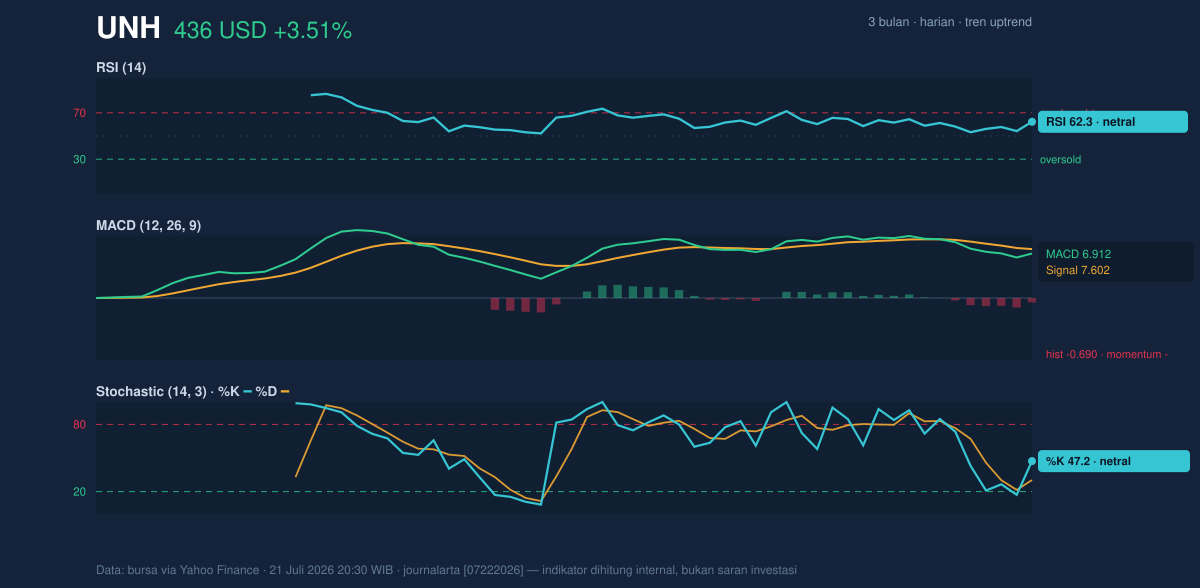
Momentum is more mixed than the price trend. The RSI at 62.3 is still in neutral territory, which suggests the stock is not yet at an extreme, but it is leaning toward the stronger end of the scale. The Stochastic %K at 47.2 and %D at 30.3 also read as neutral, though %K is above %D, a short-term sign that buyers have regained some control. The more cautionary signal comes from MACD at 6.912 versus its signal line at 7.602, leaving a negative histogram of -0.690. That combination means the stock’s trend is still up, but the latest push has not yet been fully confirmed by momentum. In other words, price is leading the indicators rather than being fully backed by them.
That gap matters. When a stock is near resistance and MACD is still below its signal line, the market is often pausing after a strong run rather than entering a clean acceleration phase. The fact that RSI is not overbought gives UNH room to extend, but the MACD warning says the next move needs confirmation.
Volatility & Volume
Volatility is moderate. The ATR at 13.37, equal to 3.1% of price, suggests daily swings are meaningful but not disorderly. That fits with the Bollinger setup: the bands are relatively tight, with a 6.8% width, and the chart shows a squeeze. A squeeze usually means the market has compressed and is preparing for a larger move, though it does not say direction on its own. With price at %B 97%, UNH is trading very close to the top of its Bollinger envelope. That tells readers the stock is behaving like a strong trend name, but also one that may need fresh demand to keep climbing from here.
Volume supports the move, but only moderately. The latest session traded 6,830,300 shares versus a 20-day average of 6,340,805, or about 1.1× normal. That is enough to show participation, though not enough to call it an explosive breakout. The rising OBV, or on-balance volume, is the more encouraging clue: it suggests volume has generally been flowing in the same direction as price, which strengthens the case that the rally is not happening in a vacuum.
Key Levels & Scenarios
The near-term map is straightforward. 436.35 is the immediate resistance zone because the stock is already sitting there. If UNH can hold above that level, the chart opens room toward the prior 3-month high at 461.62. If the stock fails to stay above the upper band and slips back through the Bollinger middle at 422.70, the next important area is the 405.80 support zone, which also sits close to the SMA50 at 405.30. That overlap matters because when a moving average and support cluster together, they usually become a more important decision point for traders watching trend health.
Technical Verdict: HOLD (wait & see)
HOLD (wait & see)
- Reason 1: Price remains above the SMA20 at 422.70 and SMA50 at 405.30, confirming the broader uptrend.
- Reason 2: %B at 97% and a 6.8% Bollinger squeeze show the stock is stretched near the upper band, where follow-through can happen but risk of pause is higher.
- Reason 3: MACD is below its signal line with a -0.690 histogram, so momentum has not fully confirmed the latest price strength.
- Verdict invalidated if price falls below 405.80, because that would break the nearest support and put the SMA50 at 405.30 back in play.
- Ideal Entry Range: 422.70 to 405.80
- Exit Target: 461.62
- Stop Loss protection: below 405.30, with 405.80 as the nearer warning level
For non-traders, this means UNH is still in a healthy uptrend, but it is close enough to resistance that the next move needs confirmation rather than assumption.
Summary Data UNH
| Last price | 436.35 USD |
| Change 1 day / 5 days / 1 month | 3.51% / 2.62% / 7.30% |
| Trend / MA-cross | uptrend / none |
| SMA20 / SMA50 | 422.70 / 405.30 |
| RSI (14) / Stochastic %K | 62.3 / 47.2 |
| Bollinger %B / ATR | 97% / 13.37 |
| Support / Resistance 20 days | 405.80 / 436.35 |
| Data as of | 21 Juli 2026 20:30 WIB |

