Shell Stock Analysis: Drops 1.13%, Momentum Weakens
On Agustus 10, 2026: price 3,277.50 GBp, trend uptrend, RSI 54.5, support 3,109.00, resistance 3,405.50. technical analysis of shell stock.

Shell plc slipped on the London Stock Exchange on 7 August 2026, with the shares closing at 3,277.50 GBp, down 1.13% on the day, as traders weighed a still-positive trend against softer short-term momentum. The move matters because Shell is not breaking down from its broader structure, but it is also not acting like a stock in clean acceleration; it is sitting in the awkward middle ground where trend support remains intact while momentum signals are cooling.
Trend & Price Action
The first thing to notice is that Shell remains in an uptrend, helped by a rising SMA20 at 3,266.73 and a much lower SMA50 at 3,142.66. That gap tells you the medium-term trend is still constructive: the shorter average is above the longer one, and the price is holding just above the 20-day average rather than losing it decisively. In plain terms, the market is still paying a premium for Shell’s recent strength, even if that premium has narrowed.
As shown in the chart, the shares are also trading well inside the recent band rather than at an extreme. The price sits at about 57% of the 20-day range, with support at 3,109.00 and resistance at 3,405.50. That placement is important: it suggests the market is neither stretched near resistance nor washed out near support, which often leads to consolidation unless a fresh catalyst arrives.
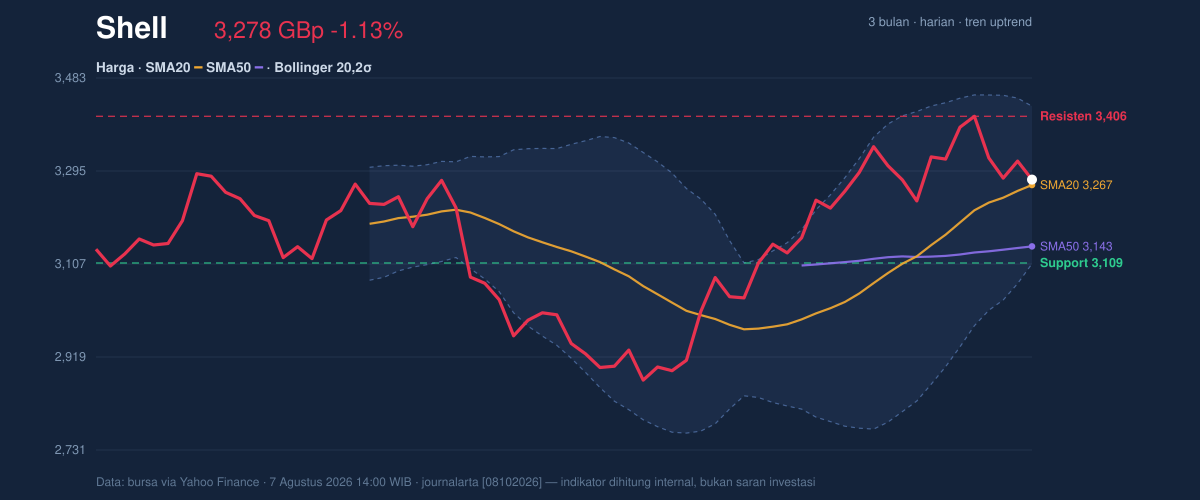
The broader three-month range adds context. Shell’s 3-month high is 3,758.50 and the 3-month low is 2,559.50, so the stock has already recovered a meaningful amount from the lower end of its range. But it is still below the upper boundary, which means the chart has room to extend if buyers regain control. For now, the price action says the uptrend is alive, but the pace has slowed.
Oscillators & Momentum
Momentum is where the story becomes more cautious. The RSI at 54.5 is neutral, which usually means neither buyers nor sellers have a clear emotional edge. It is not an overbought reading, so the stock is not obviously overextended, but it also is not showing the kind of force that often accompanies a strong breakout.
The Stochastic %K at 32.5 and %D at 44.1 are also neutral, though they lean softer than the price trend itself. Stochastic compares recent closes with the recent range, so a lower reading here can signal that short-term buying pressure has faded even while the broader trend remains intact. That mismatch matters: it often shows up when a stock is pausing rather than reversing.
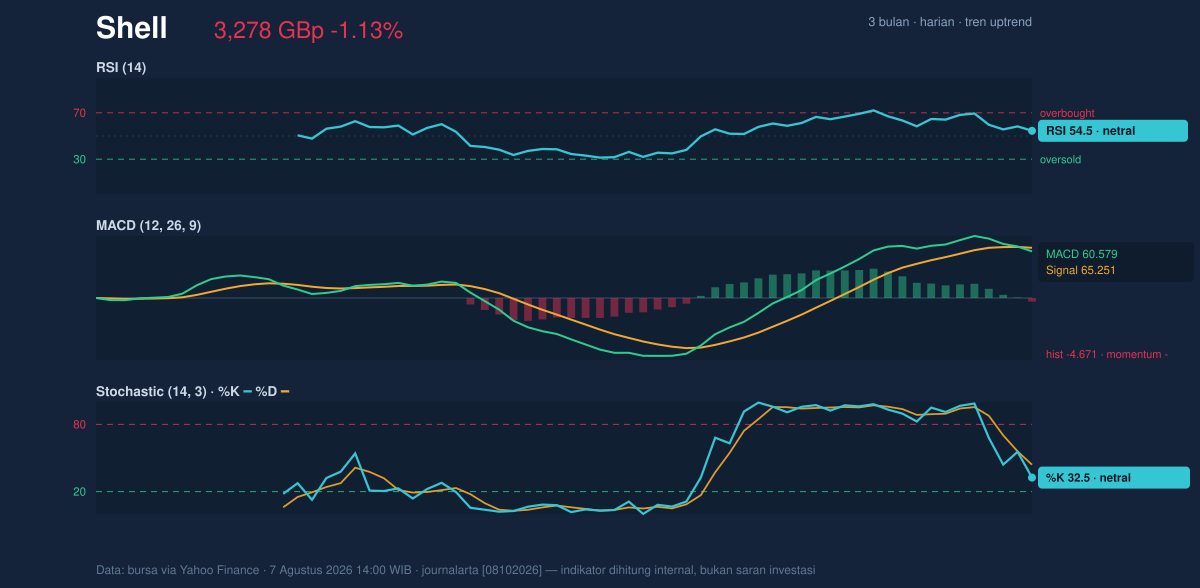
The clearest warning comes from MACD. Shell’s MACD at 60.579 sits below its signal at 65.251, leaving a -4.671 histogram. In practical terms, that negative histogram means the faster trend has slipped under the slower one, a sign that upside momentum is losing speed. It does not by itself confirm a downtrend, but it does say the recent advance is no longer accelerating. Combined with the neutral RSI, the message is simple: trend support is still there, but momentum is not yet confirming a fresh leg higher.
Volatility & Volume
Volatility is moderate rather than explosive. The ATR(14) of 73.30, equal to 2.2% of price, suggests Shell can still move enough to matter in a session, but the market is not pricing in a disorderly swing. The Bollinger Bands reinforce that sense of balance: the upper band is 3,425.76, the middle band is 3,266.73, and the lower band is 3,107.69. With %B at 53% and band width at 9.7%, the stock is sitting near the middle of a normal volatility envelope.
That is a useful signal. A mid-band position usually means the stock has not yet committed to an expansion move, while a normal band width argues against a squeeze that would typically precede a sharp breakout. In other words, Shell is not coiled like a spring; it is drifting within an established range.
Volume offers only modest confirmation. The latest turnover of 10,116,124 shares was about 1.1× normal versus the 20-session average of 9,376,373, so participation was slightly above average but not forceful enough to override the weaker momentum backdrop. More notably, OBV is falling, which means volume has not been consistently supporting price strength. That divergence matters because a rising price with declining OBV can hint that rallies are being met by distribution rather than broad accumulation.
Key Levels & Scenarios
The immediate map is clear. 3,266.73 is the first line to watch because it is both the SMA20 and the Bollinger middle band. A sustained hold above that level would keep the uptrend structure intact and suggest the latest pullback is just a pause. If Shell pushes through 3,405.50, the chart would begin to look more constructive, because that would clear the 20-day resistance zone and move price toward the upper Bollinger band at 3,425.76.
On the downside, 3,109.00 is the key support. A clean break below it would weaken the current trend setup and expose the lower Bollinger band at 3,107.69, which is effectively the same danger zone. Below that, the market would start to question whether the recent uptrend is merely pausing or actually rolling over.
Technical Verdict: HOLD (wait & see)
HOLD (wait & see)
- Trend remains positive: price is above the SMA20 at 3,266.73 and well above the SMA50 at 3,142.66.
- Momentum is not confirming: MACD is below signal with a -4.671 histogram, while RSI 54.5 and Stochastic 32.5/44.1 are neutral.
- Volume/OBV are mixed: trading was only 1.1× normal and OBV is down, so participation is not yet strong enough to validate a breakout.
- Invalidation: this verdict is invalidated if price falls below 3,109.00, because that would break the main support zone and weaken the trend structure.
- Ideal Entry Range: 3,266.73 to 3,109.00
- Exit Target: 3,405.50 to 3,425.76
- Stop Loss protection: below 3,107.69
For non-traders, this means Shell is still standing on solid ground, but the market is waiting to see whether buyers can prove they are back in charge. “The trend is still there,” one market participant might say, “but the conviction is not.”
Summary Data Shell
| Last price | 3,277.50 GBp |
| Change 1 day / 5 days / 1 month | -1.13% / -3.13% / 7.87% |
| Trend / MA-cross | uptrend / none |
| SMA20 / SMA50 | 3,266.73 / 3,142.66 |
| RSI (14) / Stochastic %K | 54.5 / 32.5 |
| Bollinger %B / ATR | 53% / 73.30 |
| Support / Resistance 20 days | 3,109.00 / 3,405.50 |
| Data as of | 7 Agustus 2026 14:00 WIB |


