Momentum Gains, Tencent Stock Drops 0.08% Today
On Agustus 10, 2026: price 478.80 HKD, trend uptrend, RSI 55.6, support 434.60, resistance 492.20. technical analysis of tencent stock.

Tencent Holdings edged lower on the Hong Kong exchange in early August, with 0700.HK last at HKD 478.80, slipping 0.08% from the previous close of HKD 479.20 as traders weighed a still-intact uptrend against a market that has already travelled much of its recent range. The stock remains above its SMA20 at HKD 466.87 and well above its SMA50 at HKD 454.15, which matters because it shows the pullback is happening inside a broader rising structure rather than at the start of a breakdown. Momentum is not flashing a warning yet, but it is no longer accelerating either: the technical picture is more “steady climb” than “breakout sprint.”
Trend & Price Action
Tencent’s chart shows a stock still leaning upward, but doing so with less urgency than earlier in the move. The SMA20 is rising at 1.15% over five days, a sign that the short-term trend is still pushing higher, and the lack of a fresh MA-cross means the market has not produced a new moving-average signal to force a change in interpretation. Price sitting above both the 20-day and 50-day averages usually tells traders that buyers remain in control on the intermediate horizon. But the more important detail is where the shares sit inside the recent range: at 77% of the 20-hour range, Tencent is closer to the upper end than the lower end, which implies there is less room before the stock runs into prior supply.
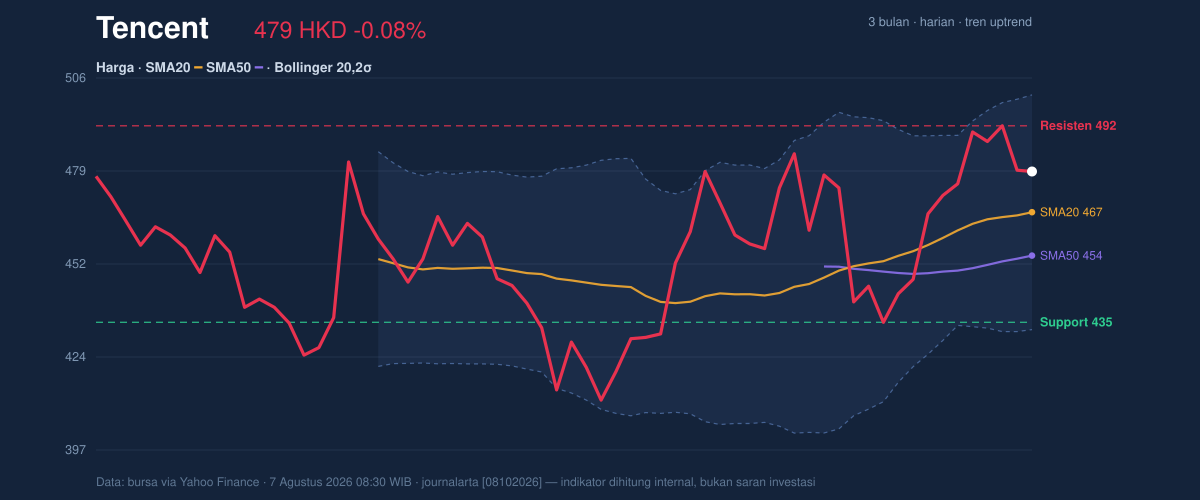
The chart also shows a stock that is approaching an area where prior rallies have met resistance. Resistance sits at HKD 492.20, just below the 3-month high of HKD 497.80, while support is at HKD 434.60. That spacing matters because it frames the current move as a test of whether the market can keep climbing toward the top of the recent band, or whether it will settle back into the middle of the channel. The small daily decline does not alter the structure, but it does suggest the stock may need a fresh catalyst to push beyond the upper end of the range.
Oscillators & Momentum
Momentum indicators are broadly constructive, though not euphoric. RSI at 55.6 is neutral, which means the stock is neither overbought nor oversold; in plain language, it is advancing without showing the kind of stretched condition that often precedes a sharp pause. Stochastic %K at 71.1 and %D at 78.1 also sit in neutral territory, but they are high enough to show the stock is trading in the upper half of its recent momentum band. That often supports continued strength, yet it also tells readers the move is mature enough that upside can become more selective.
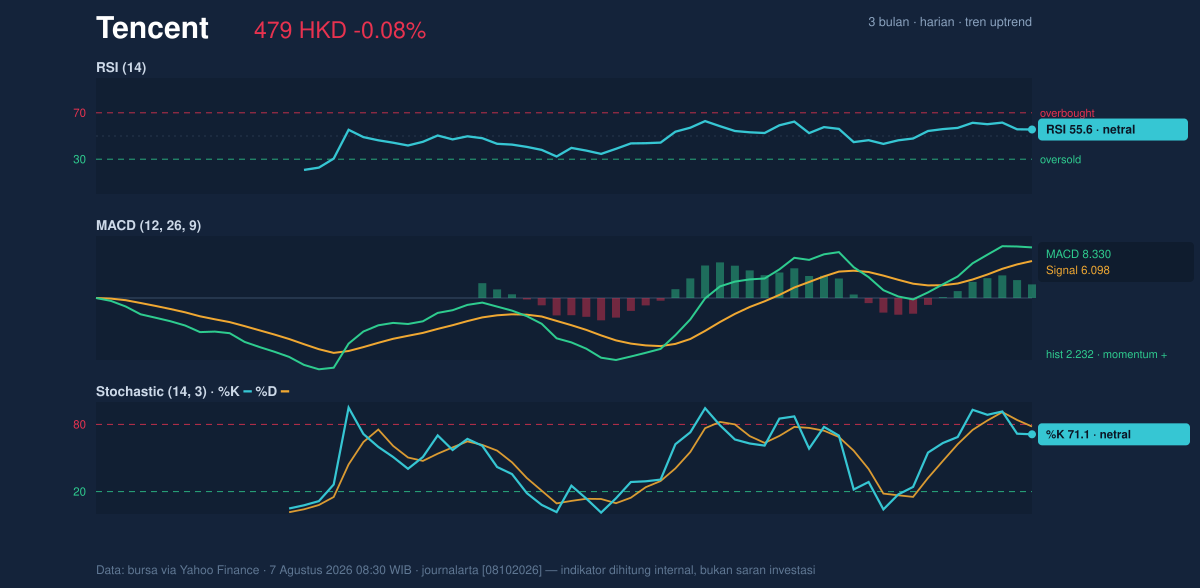
The cleaner signal comes from MACD. MACD at 8.330 is above the signal line at 6.098, with a positive histogram of 2.232. That combination usually means upward momentum is still intact, even if the pace is not accelerating aggressively. In practical terms, the market is not showing a bearish reversal pattern; instead, it is showing a trend that is still supported, but one that may need volume or a stronger catalyst to extend meaningfully beyond resistance.
Volatility & Volume
Volatility is moderate rather than explosive. ATR(14) at 14.93, or 3.1% of price, suggests Tencent is moving enough to create tradable swings, but not enough to imply disorder. The Bollinger Band setup reinforces that view. With price above the middle band at HKD 466.87 and %B at 67%, the stock is trading in the upper portion of its band, which usually indicates a constructive bias without a full overextension signal. The Bollinger band width of 14.7% is described as normal, so there is no squeeze pointing to an imminent volatility burst, nor a wide expansion suggesting the move has already become unstable.
Volume, however, is the one softer note. Last volume of 16,319,939 was only 0.6× the 20-day average of 29,305,214, which means the latest move lacked broad participation. That matters because price advances are more convincing when accompanied by heavier turnover. Still, OBV is rising, and that is important: on-balance volume tracks whether money is generally flowing into or out of the stock. A rising OBV tells us the broader accumulation trend remains positive even if the latest session was quiet. In short, Tencent is drifting upward on supportive structure, but not yet on forceful crowd participation.
Key Levels & Scenarios
The immediate map is straightforward. HKD 492.20 is the first key resistance, and a clean move through that area would put the 3-month high at HKD 497.80 back in play. On the downside, HKD 466.87 — the SMA20 and Bollinger middle band — is the first line that matters because it marks the center of the current trend. Below that, HKD 454.15 is the next major technical floor via the SMA50, and HKD 434.60 is the broader support level that would signal a more serious loss of trend quality if it came under pressure.
The signal is therefore conditional rather than absolute. If Tencent can hold above the 20-day average and keep MACD positive, the stock remains structurally supported. If it slips back below the middle band and then loses the 50-day average, the chart would start to look more like consolidation than continuation.
Technical Verdict: HOLD (wait & see)
HOLD (wait & see)
- MACD remains positive and above its signal line, which confirms the uptrend is still alive.
- Price is above SMA20 and SMA50, so the broader structure is still constructive.
- Volume was light at 0.6× average, which weakens the conviction behind the latest move and argues for patience near resistance.
Verdict invalidated if price falls below HKD 434.60.
- Ideal Entry Range: HKD 466.87 to HKD 454.15
- Exit Target: HKD 492.20 to HKD 497.80
- Stop Loss: below HKD 434.60
For non-traders, this means Tencent still looks technically healthy, but the stock is close enough to resistance that the chart is asking for confirmation rather than enthusiasm.
“The market is still saying the trend is intact — but it is also saying, ‘show me the volume.’”
Summary Data Tencent
| Last price | 478.80 HKD |
| Change 1 day / 5 days / 1 month | -0.08% / 0.76% / 4.04% |
| Trend / MA-cross | uptrend / none |
| SMA20 / SMA50 | 466.87 / 454.15 |
| RSI (14) / Stochastic %K | 55.6 / 71.1 |
| Bollinger %B / ATR | 67% / 14.93 |
| Support / Resistance 20 days | 434.60 / 492.20 |
| Data as of | 7 Agustus 2026 08:30 WIB |

