ADBE Stock Technicals Today: Gains 4.54%, Testing Key Resistance
On Agustus 14, 2026: price 270.49 USD, trend uptrend, RSI 63.8, support 212.17, resistance 272.96. technical analysis of adbe stock. ADBE Stock Technicals —…

Adobe Inc. (ADBE) rose to 270.49 USD on Nasdaq, extending a short-term advance that has pushed the stock close to its near-term ceiling, with the latest move coming after a 4.54% one-day gain and a 14.95% rise over the past month. The price now sits well above both the SMA20 at 248.15 and the SMA50 at 230.37, which tells the market is still rewarding the recent trend rather than fading it. But the stock is also trading near the top of its recent range, and that matters: when a share is already near resistance, good news tends to show up less as a breakout and more as a test of whether buyers can keep paying up. The chart shows a stock with momentum, but also one that is getting stretched.
Trend & Price Action
As shown in the chart, Adobe remains in an uptrend, and the SMA20 slope of 4.12% over 5 days suggests that the short-term trend is not just intact but still accelerating. Price above the SMA20 and SMA50 usually signals that recent buyers are in control and that dips are being absorbed rather than punished. The absence of a fresh MA-cross means there is no new moving-average trigger here; instead, the message is simpler and more durable: the stock has already moved into a stronger technical posture and is now trying to hold it.
The positioning is important because Adobe is trading at 96% of its 20-hour range, just under 20-hour resistance at 272.96, while the 3-month high is 275.44. That places the shares in a narrow zone where the market must decide whether to break higher or pause and digest gains. When price sits this close to resistance, the next move often depends less on trend direction and more on whether momentum can stay firm enough to force a new high.
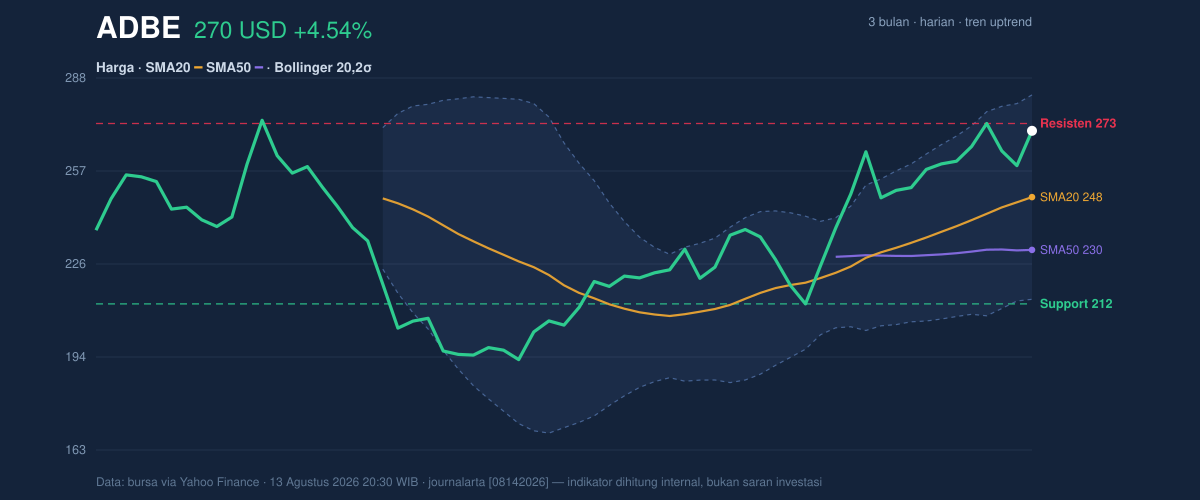
A short move above resistance would shift attention toward the 3-month high at 275.44. Failure to do so would leave the stock vulnerable to a pullback toward the mid-range.
Oscillators & Momentum
The momentum picture is mixed, and that is the key nuance. The RSI at 63.8 is still described as neutral, which means the stock is not yet in a classic overbought warning zone. But the Stochastic %K at 93.9 and %D at 84.5 are both elevated, with the oscillator flagged as overbought. In plain English, this means the recent advance has been fast enough that short-term traders may already be crowded on the same side of the trade, even if the broader trend has not broken.
That tension matters because momentum indicators are not all saying the same thing. The MACD at 11.061 remains above its signal at 9.637, with a positive histogram of 1.424. This is the cleaner confirmation in the set: it says the trend still has forward force, and the recent price advance is backed by improving internal momentum rather than merely a one-day spike.
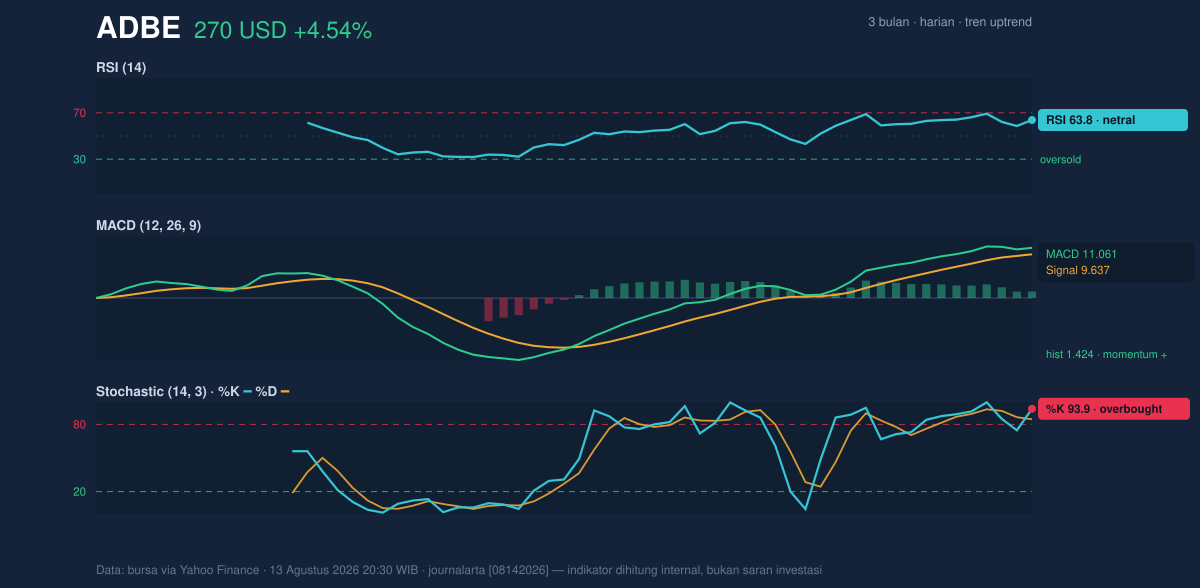
So the signal is not “overbought therefore weak.” It is more specific: momentum is still positive, but the stock is now in the zone where follow-through matters more than enthusiasm.
Volatility & Volume
Volatility is clearly elevated. The Bollinger Bands are widening, with band width at 27.8%, and the ATR(14) at 12.67 equals 4.7% of price. That combination means the stock has room to move, but also that swings can be sharp enough to shake out weak holders. The %B at 82% places the price in the upper part of the band structure, which usually indicates strength, but also a market that is already trading near the hotter end of its recent distribution.
Volume does not yet show a dramatic surge. Last volume was 5,198,200 versus a 20-day average of 5,361,600, or about 1.0× normal. That matters because breakouts are more convincing when activity expands decisively. Here, the move has been supported by participation, but not by a volume burst that would shout conviction. Still, OBV is rising, which is a useful confirmation: the cumulative volume trend is improving, suggesting buyers have been willing to step in on balance even if the latest session was not exceptional in turnover.
The message from volatility and volume is straightforward. Adobe has the energy to keep moving, but the market has not yet delivered the kind of heavy participation that would make an upside break feel fully settled.
Key Levels & Scenarios
The nearest technical map is clear. On the downside, support at 212.17 is the broad floor from the 20-hour range, but the more immediate cushion is the SMA20 at 248.15. If price starts to slip, that moving average is the first place where trend followers will look for a hold. On the upside, resistance at 272.96 is the immediate barrier, followed by the 3-month high at 275.44.
If Adobe clears 272.96 with follow-through, the chart opens a path toward a fresh test of the 275.44 high. If it fails there, the more likely response is a retreat toward the SMA20 at 248.15, where the trend would be tested rather than broken. A deeper loss of that average would weaken the current structure and shift focus toward the broader 212.17 support.
Technical Verdict: HOLD (wait & see)
HOLD (wait & see)
- The trend is still constructive because price is above the SMA20 at 248.15 and SMA50 at 230.37, with the MACD above signal and a positive histogram.
- The stock is also near resistance, with Stochastic overbought and price at the top of the range, which raises the chance of a pause before any further advance.
- Bollinger Bands are widening and ATR is high, so the setup can move quickly, but the current price is stretched enough that confirmation matters more than chasing the move.
Verdict invalidated if price breaks below 248.15.
- Ideal Entry Range: 248.15 to 252.00
- Exit Target (Target Price): 272.96 to 275.44
- Stop Loss protection: 230.37
In plain English: Adobe’s chart still looks healthy, but it is close enough to resistance that the next move needs to prove itself before the trend can be treated as fully extended.
The next technical test is whether Adobe can turn 272.96 into support, with traders watching the 3-month high at 275.44 as the next scheduled chart milestone.
Summary Data ADBE
| Last price | 270.49 USD |
| Change 1 day / 5 days / 1 month | 4.54% / 3.94% / 14.95% |
| Trend / MA-cross | uptrend / none |
| SMA20 / SMA50 | 248.15 / 230.37 |
| RSI (14) / Stochastic %K | 63.8 / 93.9 |
| Bollinger %B / ATR | 82% / 12.67 |
| Support / Resistance 20 days | 212.17 / 272.96 |
| Data as of | 13 Agustus 2026 20:30 WIB |


