NFLX Stock Gains 5.43% Today, Testing Key Resistance
On Agustus 14, 2026: price 78.24 USD, trend sideways, RSI 62.2, support 67.60, resistance 78.24. technical analysis of nflx stock. NFLX Stock Gains — full…

Netflix shares on NASDAQ were marked at 78.24 USD as of 13 August 2026 20:30 WIB, up from the previous close of 74.21, a move that put the stock at the top of its recent trading band and just above the upper Bollinger line, according to data sourced from Yahoo Finance via the exchange feed. The immediate message from the tape is not simply that the stock rose, but that buyers were willing to pay up into a zone where short-term momentum is already stretched. That matters because price strength above the band often signals persistence, yet it can also mark the point where enthusiasm gets ahead of itself.
Trend & Price Action
The broader structure is still best described as sideways, but with a slight upward bias: the SMA20 at 72.32 is rising at 0.62% over 5 days, and the share price is trading above the SMA20 and also above the SMA50 at 74.91. In plain terms, that means the market has moved back into the zone where short-term traders are in control, even if the longer pattern has not yet broken into a clean trend. There is no new MA-cross, so this is not a fresh moving-average breakout story; it is more a case of price recovering and pressing higher inside an established range.
The stock is also sitting at the top of its visible range: the 20-hour resistance at 78.24 has effectively been met, while the 20-hour support at 67.60 remains the main floor beneath it. The gap between those levels is wide enough to allow movement, but not so wide that the stock can ignore either boundary for long. The 3-month range, from 65.08 to 91.48, shows that the current price is still below the upper end of the broader swing, but it is no longer cheap relative to the recent band.
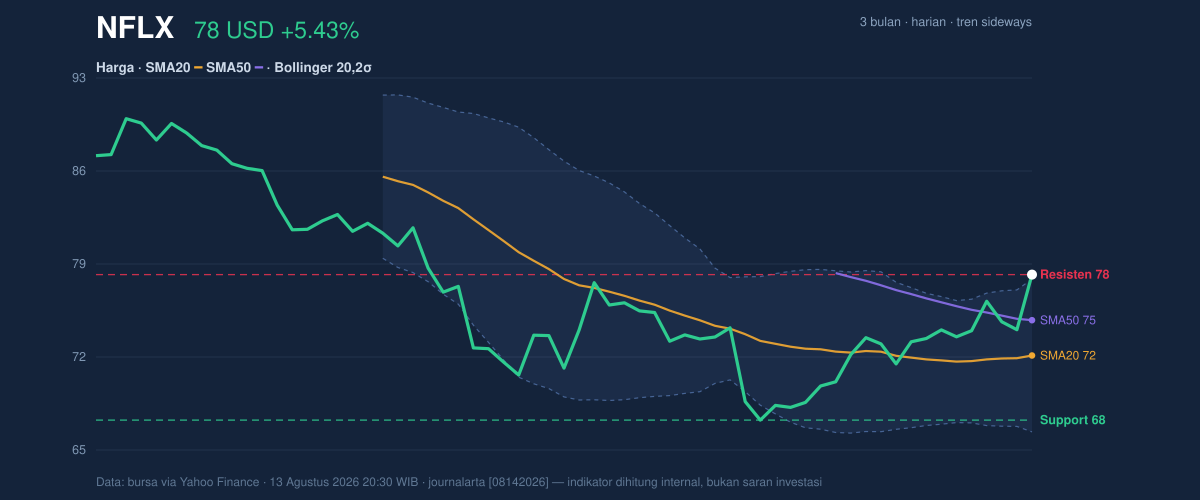
Price at the upper edge of the Bollinger band usually means the market is testing whether demand can keep extending the move or whether it is running into short-term exhaustion. Here, the signal is mixed: the trend has improved, but the stock is also pressing against a ceiling that often attracts profit-taking.
Oscillators & Momentum
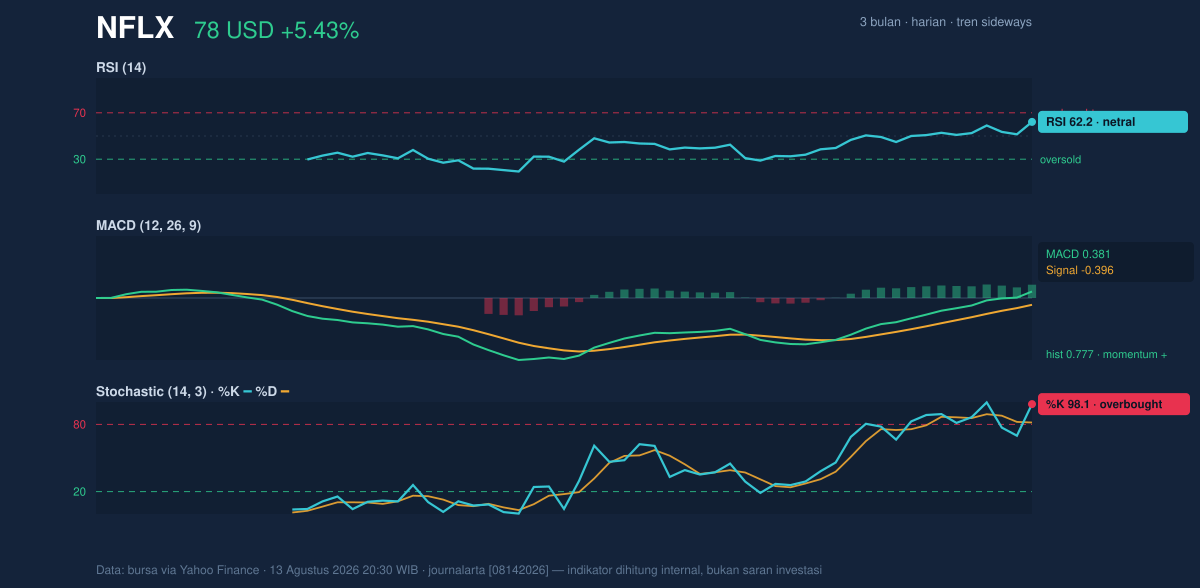
Momentum indicators are leaning positive, but they are not all telling the same story. The RSI at 62.2 is still neutral, which suggests the stock is not yet in a classic overbought condition by that measure. That is important because RSI is often used to gauge whether a move has become too crowded; here, it says the rally has room, but not unlimited room. By contrast, the Stochastic %K at 98.1 versus %D at 81.7 is clearly overbought, which usually indicates the price has advanced quickly relative to its recent range. In practical terms, that does not automatically mean reversal, but it does mean the stock is vulnerable to a pause or pullback if buyers hesitate.
The MACD at 0.381, with the signal line at -0.396 and a histogram of 0.777, is the strongest confirmation in the set. MACD turning positive while the histogram stays firmly above zero tells us upside momentum is still expanding rather than fading. That is the key counterweight to the overbought Stochastic reading. The stock can stay stretched for longer than expected when MACD and price are aligned.
Volatility & Volume
Volatility is being contained rather than exploding. The ATR at 2.30, equal to 2.9% of price, points to moderate volatility: enough for meaningful intraday swings, but not the kind of disorder that usually accompanies a major catalyst shock. The Bollinger band width of 15.5% is described as normal, which means the market is not in a squeeze that would typically precede a sharp expansion. Instead, the current setup suggests a steady grind higher rather than a compressed spring about to snap.
Volume is less convincing than the price action. The latest volume was 41,215,000 against a 20-hour average of 44,160,045, or 0.9× normal. That tells us the latest push happened without an exceptional surge in participation. In other words, the move higher has not yet been validated by a full-volume breakout. Still, OBV is rising, which means cumulative volume flow has been improving even if the latest session was not especially heavy. That combination often points to underlying accumulation, but not yet the sort of broad conviction that would turn a test of resistance into a clean breakout.
Key Levels & Scenarios
The near-term map is straightforward. 78.24 is the immediate battleground because it is both the latest price and the current resistance marker. If price can hold above that area, the next reference comes from the broader range rather than from the current chart band. If it slips, the first meaningful support is the SMA20 at 72.32, followed by the SMA50 at 74.91 as a nearby trend line that could absorb a shallow pullback. A deeper break would shift attention back toward 67.60, the 20-hour support, where the market previously found a floor.
The signal is therefore conditional rather than absolute. A hold above the upper band and resistance would reinforce the existing upward bias; failure to sustain that level would make the overbought Stochastic reading more consequential, because momentum would then be rolling over from an extended position.
Technical Verdict: HOLD (wait & see)
HOLD (wait & see)
- MACD is positive and the histogram remains supportive, showing that upside momentum is still intact.
- Price is above the SMA20 and SMA50, which keeps the short-term structure constructive.
- Stochastic is overbought and price is already at 78.24, so the stock is stretched at resistance and vulnerable to a pause.
Verdict invalidated if price falls below 72.32, which would mean the move has lost its short-term trend support.
- Ideal Entry Range: 72.32 to 74.91
- Exit Target (Target Price): 78.24, with a stretch reference toward the upper 3-month range at 91.48
- Stop Loss protection: 67.60
For non-traders, this means the stock is strong enough to watch closely, but stretched enough that waiting for confirmation is more sensible than chasing the current move.
The next test is whether Netflix can keep 78.24 as support when the market opens on the next session.
Summary Data NFLX
| Last price | 78.24 USD |
| Change 1 day / 5 days / 1 month | 5.43% / 6.17% / 5.23% |
| Trend / MA-cross | sideways / none |
| SMA20 / SMA50 | 72.32 / 74.91 |
| RSI (14) / Stochastic %K | 62.2 / 98.1 |
| Bollinger %B / ATR | 103% / 2.30 |
| Support / Resistance 20 days | 67.60 / 78.24 |
| Data as of | 13 Agustus 2026 20:30 WIB |



