NFLX Stock Gains 0.50% Today, Testing Support Level
On September 25, 2026: price 71.72 USD, trend sideways, RSI 38.7, support 71.36, resistance 82.73. technical analysis of nflx stock. NFLX Stock Gains — full…

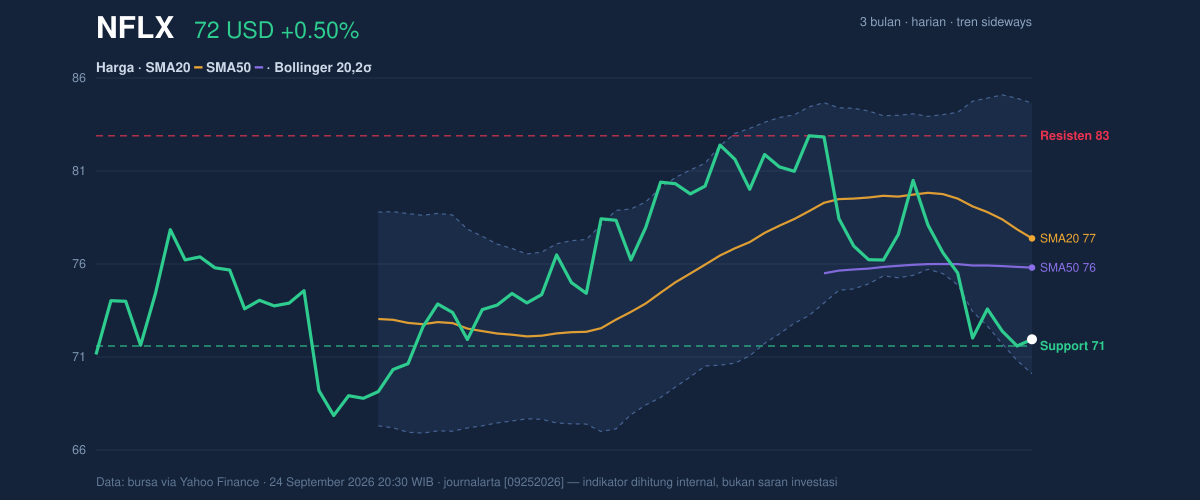
Netflix shares on NASDAQ edged up to 71.72 USD from 71.36 at the previous close, but the move sits inside a broader slide: the stock is down 4.77% over 5 days and 11.96% over 1 month, according to Yahoo Finance data cited at 24 September 2026 20:30 WIB. The chart shows a market that is not collapsing, but is still under pressure. Price remains below the 20-day SMA at 77.18 and below the 50-day SMA at 75.60, which means recent trading has been weaker than the average of the past month and two months. That matters because when a stock trades under both moving averages, rallies often meet sellers before they can turn into a durable trend.
Trend & Price Action
The broader setup is best described as sideways with a downward tilt, as shown in the chart. The 20-day moving average is sloping down 2.71% over 5 days, which signals that the short-term trend is still losing altitude rather than stabilizing. There is also no fresh MA-cross, so there is no new moving-average confirmation that momentum has changed hands. In plain language: the stock has not yet done the kind of price work that usually marks a cleaner trend reversal.
That said, the current price is not far from the lower end of the recent band. Netflix is trading at 71.72, only slightly above the 20-hour support at 71.36, and within 3% of the range low versus the 20-hour resistance at 82.73. The 3-month low of 65.08 remains below, while the 3-month high of 83.60 is still well overhead. This positioning suggests the market is testing whether the recent decline has reached a floor, but has not yet proved it.
A short bounce is possible. A trend reversal is not yet confirmed.
Oscillators & Momentum
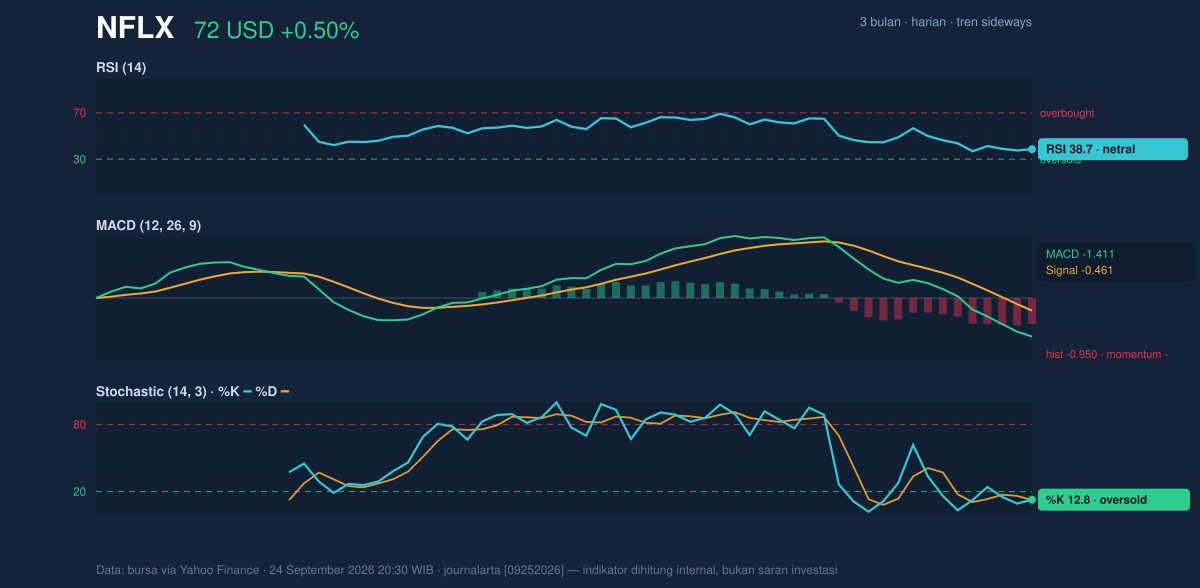
The momentum picture is mixed, and that mix is important. RSI at 38.7 is still neutral, which means the stock is not deeply oversold in the classic sense. But Stochastic %K at 12.8 and %D at 12.4 are both in oversold territory, which often signals that short-term selling has been stretched. In practical terms, the Stochastic reading says the stock has been pushed hard enough that a rebound can appear if sellers pause. It does not guarantee one; it simply says the downside may be getting crowded.
The more cautionary signal comes from MACD at -1.411, with the signal line at -0.461 and histogram at -0.950. That combination means downside momentum is still stronger than the recent trend baseline. When MACD remains negative while Stochastic is oversold, the message is usually: the stock may be stretched, but the trend has not yet turned. That is the difference between a bounce and a durable turn.
In other words, the stock looks tired, not healed.
Volatility & Volume
Volatility is present but not extreme. The ATR of 2.27, equal to 3.2% of price, points to a market that can still move meaningfully in either direction without being disorderly. The Bollinger Bands add another layer: the lower band sits at 69.86, the middle band at 77.18, and the upper band at 84.50. Price is near the bottom of that envelope, with %B at 13%, which means the stock is trading very close to the lower band rather than near the middle or top of its recent volatility range.
That matters because Bollinger positioning often tells you whether a move is extended. A low %B does not automatically mean “cheap”; it means price is hugging the lower edge of its normal range. If buyers step in, the first test is usually the middle band at 77.18. If they do not, the lower band at 69.86 becomes the next reference point.
Volume is not confirming a strong reversal yet. Last volume was 28,189,100, below the 20-day average of 32,631,295, or 0.9x normal. That tells us the latest move was not powered by unusually strong participation. Meanwhile, OBV is falling, which means cumulative volume has been aligned with the down move rather than fighting it. In simple terms, buyers have not yet shown enough conviction to overpower the existing trend.
Key Levels & Scenarios
The most immediate line in the sand is 71.36, the 20-hour support. A hold above that level keeps the door open for a reflex move toward the middle of the Bollinger Band at 77.18 and then the 20-hour resistance at 82.73. If the stock cannot hold 71.36, the chart shifts back toward the lower Bollinger band at 69.86, with the broader 3-month low at 65.08 becoming the next major reference.
The signal is therefore less about calling a dramatic turn and more about watching whether price can reclaim the short-term averages. Without that, rallies risk being treated as pauses in a downtrend rather than a new phase.
Technical Verdict: HOLD (wait & see)
HOLD (wait & see)
- Price is below SMA20 at 77.18 and SMA50 at 75.60, so the trend has not yet repaired.
- MACD remains negative, showing downside momentum still dominates.
- Stochastic is oversold and price is near the lower Bollinger band, so a bounce is possible, but it is not confirmed by volume because OBV is falling and volume is only 0.9x normal.
Verdict invalidated if price falls below 69.86.
- Ideal Entry Range: 69.86 to 71.36
- Exit Target: 77.18, then 82.73
- Stop Loss protection: below 69.86
For non-traders, this means the stock is close to a support zone, but it has not yet shown enough evidence that the downtrend is over.
Summary Data NFLX
| Last price | 71.72 USD |
| Change 1 day / 5 days / 1 month | 0.50% / -4.77% / -11.96% |
| Trend / MA-cross | sideways / none |
| SMA20 / SMA50 | 77.18 / 75.60 |
| RSI (14) / Stochastic %K | 38.7 / 12.8 |
| Bollinger %B / ATR | 13% / 2.27 |
| Support / Resistance 20 days | 71.36 / 82.73 |
| Data as of | 24 September 2026 20:30 WIB |


