Momentum Gains, GOOGL Stock Gains 1.34% Today
On September 25, 2026: price 342.36 USD, trend sideways, RSI 48.9, support 330.65, resistance 354.97. technical analysis of googl stock.

Alphabet’s shares are holding a narrow technical balance point: GOOGL last traded at 342.36 USD, just above the short-term average, while momentum is improving but not yet strong enough to call a decisive trend change. The stock is moving in a sideways pattern, and the chart suggests traders are waiting for a cleaner break from the current range rather than chasing the latest bounce.
Trend & Price Action
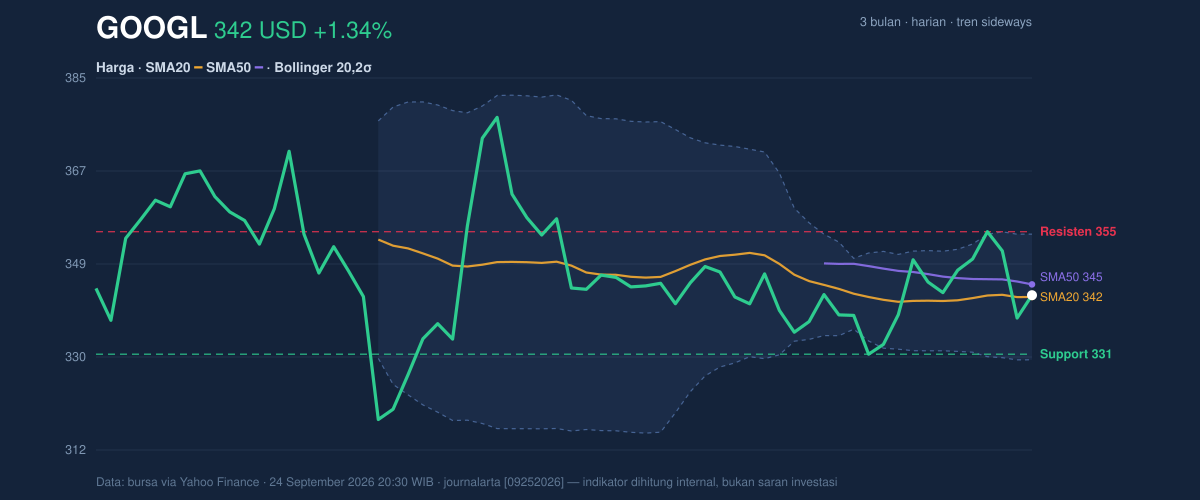
As shown in the chart, GOOGL is trading above its SMA20 at 342.01 but still below the SMA50 at 344.50. That positioning matters because it places the stock in a small but important gap between short-term stabilization and medium-term resistance. In plain terms, the price is no longer weak enough to sit clearly under near-term trend support, yet it has not reclaimed the longer moving average that would signal broader strength.
The lack of a new MA-cross is also telling. A moving-average cross is one of the market’s shorthand signals for trend change; without it, the current move looks more like consolidation than a fresh uptrend. The SMA20 slope of 0.20% over 5 days shows the stock is inching higher, but only gradually.
That is a recovery, not a breakout.
The broader range gives the move more context. GOOGL is sitting well inside its 20-hour support at 330.65 and 20-hour resistance at 354.97, and at 48% of the range it is roughly mid-channel. The 3-month high of 384.48 and 3-month low of 314.90 frame the longer arc: the stock has rebounded from the lower half of that range, but it is still far from reclaiming the upper end.
[ GRAFIK-HARGA ]
Oscillators & Momentum
The momentum picture is more constructive than the trend picture. RSI at 48.9 is neutral, which means the stock is neither overbought nor oversold. That is usually a sign of balance, but in this case it also says the recent bounce has not yet become crowded. Stochastic %K at 40.1 and %D at 44.0 are also neutral, with %K slightly below %D, which suggests near-term momentum is still recovering rather than accelerating aggressively.
The more encouraging clue is MACD at 0.282 versus signal line -0.256, with a histogram of 0.538. For general readers, MACD measures whether shorter-term price movement is gaining on longer-term movement. A positive histogram means that gap is widening in favor of upside momentum. That does not guarantee a sustained rally, but it does show the latest price action is better than the recent baseline.
In other words: the trend is cautious, but the engine is turning over.
[ GRAFIK-MOMENTUM ]
Volatility & Volume
Bollinger Bands add another layer to the story. The middle band at 342.01 is almost exactly where the stock is trading, while the upper band sits at 354.48 and the lower band at 329.54. With %B at 51%, price is sitting just above the midpoint of the band structure, which reinforces the idea of equilibrium rather than extension. More important, the 7.3% band width is described as a squeeze, meaning volatility has compressed. In market terms, that often precedes a larger move, but the direction still needs confirmation.
ATR supports that reading. The ATR(14) of 9.08, equal to 2.7% of price, points to moderate daily movement rather than wild swings. That matters because a squeeze with moderate ATR can create a sharp move once participation returns.
Volume has not yet fully confirmed the latest lift. The most recent 23,746,900 shares traded below the 20-hour average of 26,980,345, or 0.9x normal. That means the rebound is happening without strong crowd participation. Still, OBV is rising, which is a quieter but useful sign that buying pressure has been building over time even if the latest session did not come with heavy turnover.
Key Levels & Scenarios
The market is now watching whether GOOGL can turn the 342.01–344.50 zone from a hesitation area into a support platform. If the price can move through the 354.48–354.97 band, the chart would start to look less like a range and more like a breakout attempt from a volatility squeeze. If it fails there, the stock remains trapped in the middle of its recent structure.
The downside line is equally important. A break back below 330.65 would weaken the current stabilization and reopen the lower half of the three-month range, where the 314.90 low becomes the next major reference. Because the bands are compressed, either side of the range could move quickly once one of these levels gives way.
Technical Verdict: HOLD
HOLD (wait & see)
- MACD is positive, which shows improving momentum, but RSI at 48.9 and Stochastic at 40.1 / 44.0 remain neutral, so confirmation is incomplete.
- Price is above SMA20 but still below SMA50 at 344.50, keeping the stock in a sideways-to-recovering pattern rather than a confirmed uptrend.
- Bollinger Bands are squeezed, which raises the odds of a larger move, but direction is not yet proven by volume, since trading is only 0.9x normal.
- Invalidation condition: this verdict is invalidated if price falls below 330.65, which would weaken support and shift the structure back toward the lower range.
- Ideal entry range: 342.01 to 344.50
- Exit target: 354.48 to 354.97
- Stop loss protection: below 330.65
For non-traders, this means Alphabet’s chart is improving, but the stock still needs a stronger signal before the move becomes convincing.
“The market is waiting for proof, not promises.”
Summary Data GOOGL
| Last price | 342.36 USD |
| Change 1 day / 5 days / 1 month | 1.34% / -1.43% / 0.11% |
| Trend / MA-cross | sideways / none |
| SMA20 / SMA50 | 342.01 / 344.50 |
| RSI (14) / Stochastic %K | 48.9 / 40.1 |
| Bollinger %B / ATR | 51% / 9.08 |
| Support / Resistance 20 days | 330.65 / 354.97 |
| Data as of | 24 September 2026 20:30 WIB |


