CSCO Stock Analysis: Gains 0.51%, Testing Support Level
On September 25, 2026: price 106.97 USD, trend downtrend, RSI 42.1, support 106.43, resistance 112.15. technical analysis of csco stock.

Cisco Systems edged up to 106.97 USD on NASDAQ, a modest 0.51% rise from the prior close, but the broader tape still points to pressure rather than recovery. The stock remains below both its SMA20 at 109.33 and SMA50 at 112.51, which matters because prices below short- and medium-term moving averages usually signal that rallies are being sold into rather than embraced. The chart also shows a downtrend with the 20-day average sliding at -0.61% over five days, while volume jumped to 32,360,400, or 1.8 times the 20-hour average, even as OBV continued to fall. That combination often means trading activity is rising, but the balance of that activity still favors distribution.
Trend & Price Action
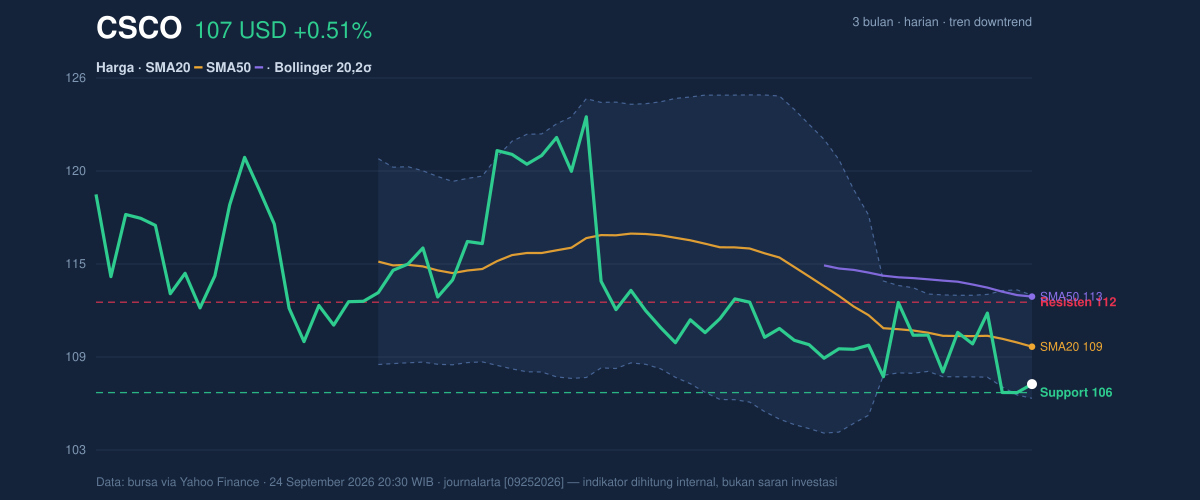
The price is sitting just above the 20-hour support at 106.43, which is important because it places Cisco near the lower edge of its recent trading band rather than in the middle of it. The stock is also only about 9% up from the lower end of the 20-hour range, with resistance at 112.15. In practical terms, that means the market is still pricing Cisco as a name that has to prove it can reclaim lost ground before the trend can stabilize.
The broader three-month range helps explain the setup. Cisco is trading well below the 3-month high of 124.71 and only slightly above the 3-month low of 104.51. That proximity to the lower end of the range suggests the market is still testing whether recent weakness is just a pause or part of a larger repricing. The absence of a fresh MA cross also matters: there is no new moving-average reversal to signal that the downtrend has exhausted itself.
The Bollinger Bands reinforce that caution. Price is near the lower band at 106.07, with %B at 14%, meaning the stock is trading close to the bottom of its recent volatility envelope. When a stock hugs the lower band, it often reflects persistent selling pressure. Yet the 6.0% band width has narrowed, which signals a squeeze. That kind of compression does not predict direction on its own, but it does mean the next meaningful move could be sharper than the recent drift.
Oscillators & Momentum
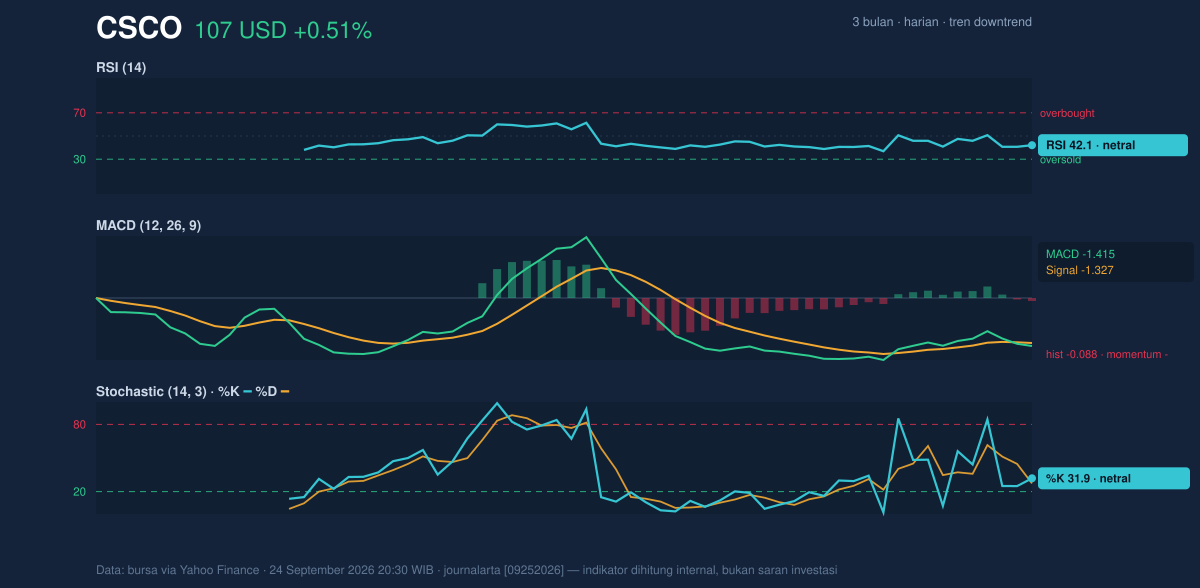
Momentum is not broken, but it is not convincing either. The RSI at 42.1 sits in neutral territory, which means Cisco is neither washed out enough to suggest a clear oversold rebound nor strong enough to confirm a fresh uptrend. The Stochastic %K at 31.9 and %D at 27.3 also remain neutral, with readings close to the lower end of the range but not yet signaling a decisive reversal. In plain language, the stock has room to bounce, but the indicators do not yet show that buyers have taken control.
The more important signal is the MACD at -1.415, still below its signal line at -1.327, with a histogram of -0.088. MACD measures whether short-term momentum is outrunning longer-term trend strength. Here, the negative reading says the recent move is still leaning downward, even if the gap is not extreme. That is a subtle but meaningful distinction: the stock is not in free fall, but it remains in a negative momentum regime.
Volatility & Volume
The ATR at 2.78, or 2.6% of price, indicates moderate volatility. That is enough for intraday swings to matter, but not so high that the stock is behaving erratically. Combined with the Bollinger squeeze, this suggests the market is coiling rather than expanding. Traders often watch this kind of setup because compressed volatility can precede a larger directional move, but the direction still has to be confirmed by price.
Volume adds a second layer of caution. The latest session’s volume was well above average, yet OBV is falling. OBV, or on-balance volume, tracks whether volume is accompanying rising or falling prices. When it trends lower while the stock is trying to stabilize, it implies that selling pressure has not fully cleared. In other words, participation is strong, but the stronger participation has recently been on the bearish side.
Key Levels & Scenarios
The immediate line in the sand is the 106.43 support. A clean hold there would keep the stock inside its short-term base and leave room for a rebound toward 109.33, then 112.15, where sellers have already shown up. Above that, the 112.59 upper Bollinger band becomes the next technical reference, because a move through the upper band would show the squeeze is resolving upward rather than simply bouncing.
If support at 106.43 fails, the chart opens back toward the 104.51 three-month low. That would not just be another lower print; it would confirm that the stock is still probing the lower end of its range and that the downtrend has not yet been interrupted. The current placement near the lower band means the downside room is not huge in percentage terms, but the signal would matter because it would show that even the nearest support has stopped attracting buyers.
Technical Verdict: HOLD (wait & see)
Cisco’s chart still leans defensive, but it is not weak enough for a clean bearish breakdown signal. The case for HOLD (wait & see) rests on three points: price remains below SMA20 and SMA50, MACD is still negative, and OBV is falling despite heavier volume. Against that, the stock is sitting near 106.43 support and close to the lower Bollinger band at 106.07, which means downside may be increasingly contested. The verdict is invalidated if price falls below 106.43, because that would expose the 104.51 low and confirm the base has failed.
- Ideal Entry Range: 106.43 to 109.33
- Exit Target: 112.15, then 112.59
- Stop Loss protection: below 106.43, with deeper technical risk toward 104.51 if that level gives way
For non-traders, this means Cisco is still trying to stop falling, but the chart has not yet shown enough strength to call the turn.
Summary Data CSCO
| Last price | 106.97 USD |
| Change 1 day / 5 days / 1 month | 0.51% / -2.97% / -4.80% |
| Trend / MA-cross | downtrend / none |
| SMA20 / SMA50 | 109.33 / 112.51 |
| RSI (14) / Stochastic %K | 42.1 / 31.9 |
| Bollinger %B / ATR | 14% / 2.78 |
| Support / Resistance 20 days | 106.43 / 112.15 |
| Data as of | 24 September 2026 20:30 WIB |


