AMD RSI Overbought: Stock Gains 2.38% (September 25, 2026)
On September 25, 2026: price 629.26 USD, trend uptrend, RSI 72.7, support 456.16, resistance 629.26. technical analysis of amd stock. AMD RSI Overbought — full…

AMD is pressing against the top of its recent trading band, and for international investors the key question is not whether the stock is moving, but whether that move is being stretched too far too fast.
Advanced Micro Devices closed at 629.26 USD, up 2.38% on the day, extending gains to 15.44% over five days and 30.84% over one month, according to Yahoo Finance data cited by Nasdaq market feeds. That is a strong run by any standard, but the more important signal is how the price is behaving relative to its own trend tools: the shares are trading above the SMA20 at 520.41 and above the SMA50 at 502.12, while the golden cross — where the 20-day average moves above the 50-day average — confirms that the medium-term trend has turned firmly upward. In plain language, the market is rewarding AMD not just for a one-day pop, but for a sustained shift in direction.
Trend & Price Action
The chart shows a market that has moved from recovery into acceleration. The uptrend is backed by a SMA20 slope of 7.03% over five days, which means the short-term average itself is rising quickly rather than flattening out. That matters because a rising average often reflects persistent buying rather than a single burst of enthusiasm. AMD is also sitting at the very top of its quoted range, with 20-hour support at 456.16 and 20-hour resistance at 629.26; the price is effectively at 100% of the range. The stock has also pushed to a 3-month high of 630.80, just above the last close, which tells readers the market is testing fresh territory rather than merely bouncing inside an old range.
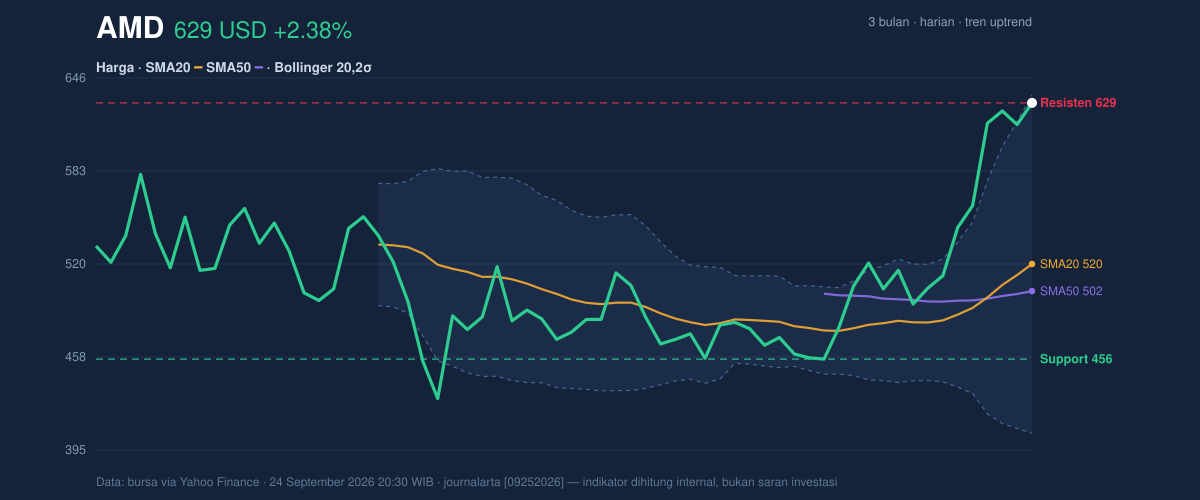
The signal here is straightforward: trend followers remain in control, but the stock is now trading where momentum often becomes fragile. When a name sits right under its recent high and at the upper edge of its band, the next move tends to be more about whether buyers can keep absorbing profit-taking than about whether the trend still exists.
Oscillators & Momentum
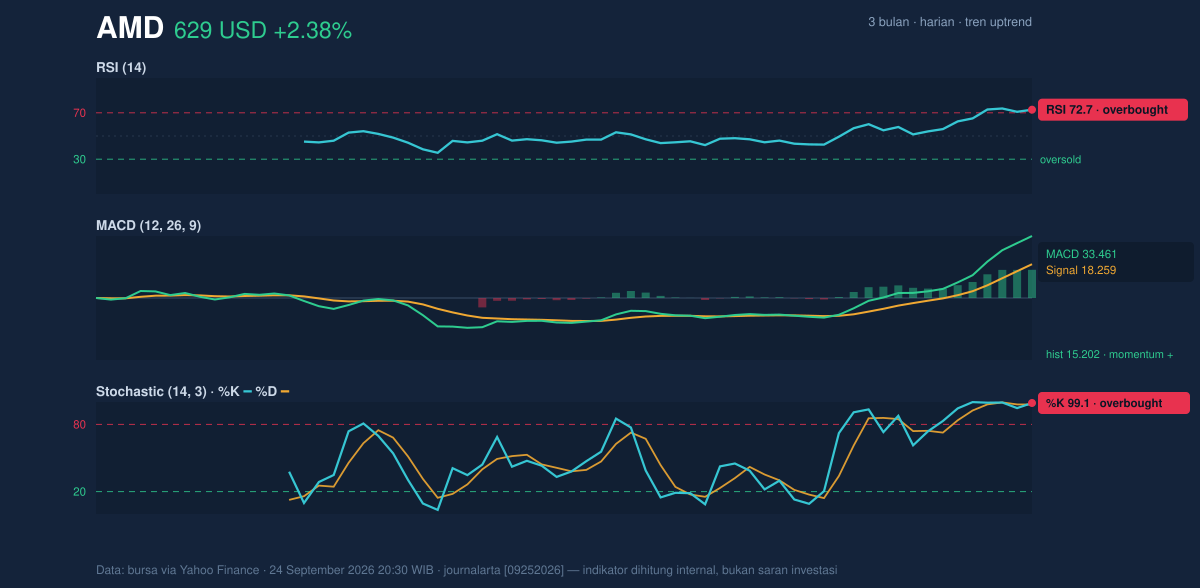
Momentum indicators are flashing strength, but they are also warning that the move has become crowded. The RSI at 72.7 is in overbought territory, while the Stochastic %K at 99.1 and %D at 97.7 are also deeply overbought. For general readers, that does not mean the stock must fall; it means the recent pace of buying has been unusually intense, and the market may be vulnerable to pauses or pullbacks as traders lock in gains. The MACD at 33.461, above its signal line at 18.259 with a 15.202 histogram, still argues that upward momentum is intact. In other words, the trend remains positive, but the oscillators say the stock has already travelled a long way in a short time.
That combination is important. When RSI and Stochastic are stretched while MACD still expands positively, the market is usually in a strong advance rather than an exhausted one. But it also means new upside needs fresh demand, because much of the easy momentum may already be priced in.
Volatility & Volume
Volatility is elevated, and that raises the stakes for every new move. The Bollinger upper band at 634.64 is only slightly above the last close, while the middle band sits at 520.41 and the lower band at 406.17. With %B at 98%, AMD is trading almost at the top of its Bollinger envelope, a sign that price is pressing the extreme of its recent statistical range. The 43.9% band width shows the envelope is expanding, which usually reflects a market that expects larger-than-usual swings rather than calm consolidation.
That reading is reinforced by the ATR(14) at 26.87, or 4.3% of price. ATR measures average daily movement, so a reading this high means traders should expect meaningful intraday swings, not a smooth climb. Volume adds some confirmation: 25,259,300 shares changed hands versus a 20-hour average of 21,564,805, or about 1.2x normal, and OBV is rising. That matters because rising volume and OBV suggest the rally is being supported by participation, not just thin trading. The move is real; it is also extended.
Key Levels & Scenarios
The immediate technical map is tight. 629.26 is both the last price and the current resistance marker, while the 3-month high at 630.80 is the next visible ceiling. Above that, the chart would be entering price discovery, where prior reference points become less useful. On the downside, the first meaningful reference is the SMA20 at 520.41, which also matches the Bollinger middle band. If price loses that area, it would signal that the market is no longer simply stretched, but starting to unwind its short-term trend. The deeper trend line sits at the SMA50 at 502.12, a level that would matter if momentum cools more sharply.
The practical read is conditional: if AMD can hold above the recent high zone, the trend remains intact; if it slips back under the short-term average, the market may be shifting from breakout mode to consolidation.
Technical Verdict: HOLD (wait & see)
HOLD (wait & see)
- RSI at 72.7 and Stochastic at 99.1/97.7 show the stock is overbought, which raises the odds of a pause.
- MACD remains positive and the golden cross supports the broader uptrend, so the trend is not broken.
- %B at 98% and ATR at 26.87 indicate the shares are stretched near the top of a volatile range.
- Verdict invalidated if price breaks below 520.41, because that would mean AMD has lost the short-term trend anchor and the Bollinger midline.
- Ideal entry range: 520.41 to 502.12
- Exit target: 630.80, then 634.64
- Stop loss protection: below 502.12, with deeper risk below 456.16
For non-traders, this means AMD is still in a strong uptrend, but it is already running hot enough that patience is more useful than urgency.
“The stock is strong, but it is also stretched — and that is where the next move can feel the most expensive.”
Summary Data AMD
| Last price | 629.26 USD |
| Change 1 day / 5 days / 1 month | 2.38% / 15.44% / 30.84% |
| Trend / MA-cross | uptrend / golden |
| SMA20 / SMA50 | 520.41 / 502.12 |
| RSI (14) / Stochastic %K | 72.7 / 99.1 |
| Bollinger %B / ATR | 98% / 26.87 |
| Support / Resistance 20 days | 456.16 / 629.26 |
| Data as of | 24 September 2026 20:30 WIB |


