NFLX Stock Analysis: Gains 3.77%, Momentum Weakens
On September 15, 2026: price 80.32 USD, trend uptrend, RSI 55.6, support 76.01, resistance 82.73. technical analysis of nflx stock. NFLX Stock Analysis — full…

Netflix rose to 80.32 USD on NASDAQ, up from 77.40 at the previous close, as the stock kept trading above its short-term average and moved deeper into the upper half of its recent range. The price action, however, is not a clean breakout story: momentum is mixed, volume is only modestly above normal, and the longer signal line on MACD still points to fading strength even as the broader trend remains constructive.
Trend & Price Action
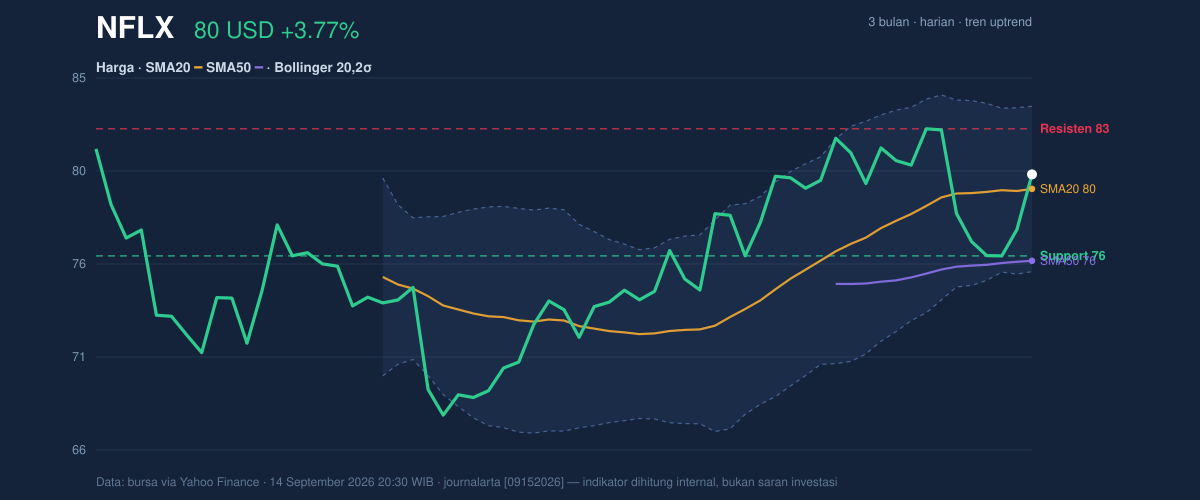
As shown in the chart, Netflix is still in an uptrend, with the SMA20 at 79.55 rising at 0.31% over 5 days and the share price holding above the SMA20. That matters because the 20-day average is often read as the market’s short-term consensus value; staying above it suggests buyers have been willing to pay a little more than they were recently. The SMA50 at 75.75 sits well below the current quote, which reinforces that the stock has recovered from a weaker base rather than simply bouncing around one level.
The latest move also places Netflix at about 64% of its 20-hour range, between 76.01 support and 82.73 resistance. That position is important: it shows the stock is not stuck at the bottom of the band, but it is still short of the ceiling where sellers have recently appeared.
A short move higher is not the same as a confirmed breakout.
The broader three-month range gives the move more context. Netflix is trading closer to the 3-month high of 83.60 than the 3-month low of 65.08, which signals recovery and resilience, but also means the stock is approaching an area where prior advances have slowed. In plain terms, the market has repaired damage, but it has not yet proven it can clear the next barrier.
Oscillators & Momentum
The momentum picture is where the story gets more cautious. The RSI at 55.6 is neutral, which means the stock is neither overbought nor oversold. That is usually a sign of balance rather than urgency. The Stochastic reading at 61.7 / 33.6 is also neutral, but the gap between the two lines suggests momentum has improved from a weaker state without yet turning emphatically strong.
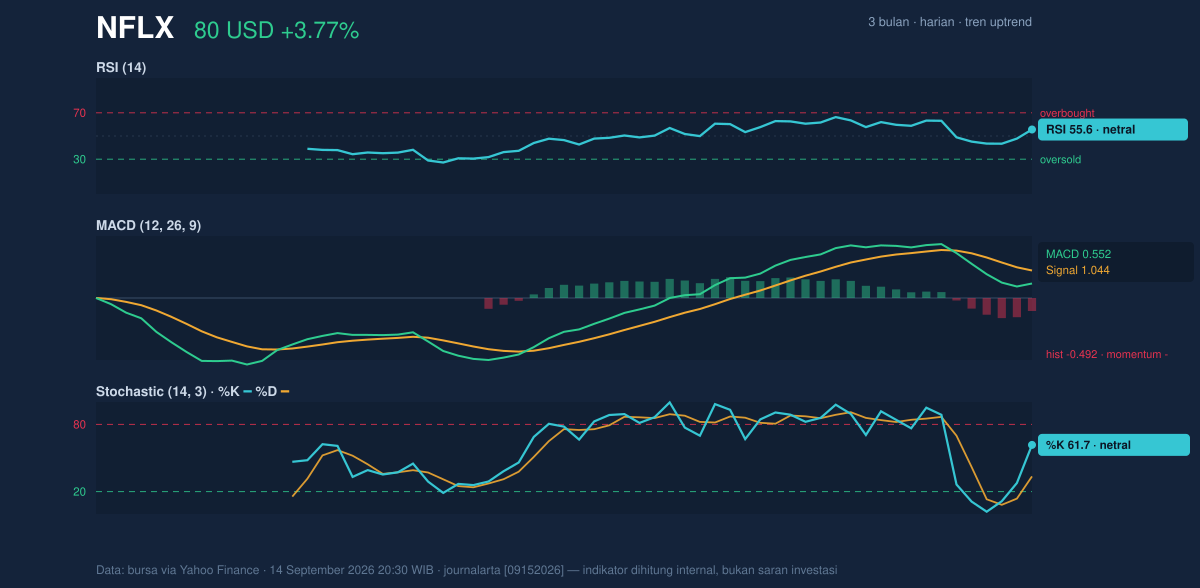
The more important warning comes from MACD at 0.552 versus its signal at 1.044, leaving a -0.492 histogram. For general readers, MACD is a trend-following indicator that compares faster and slower price movement; when the histogram is negative, it means recent momentum is lagging the broader trend. So while the price is still above key averages, the pace of the advance is not as convincing as the trend line alone would suggest.
That split matters. Trend is up. Momentum is not fully on board.
Volatility & Volume
Volatility is moderate, not extreme. The ATR at 2.24, or 2.8% of price, indicates a normal daily swing range for a stock that can move quickly when sentiment shifts. Bollinger Bands, which frame price relative to recent volatility, show the upper band at 83.92, the middle band at 79.55, and the lower band at 75.18. The %B at 59% says price is above the midline but not pressing the upper boundary, which is consistent with a stock that is advancing without yet being stretched.
The 11.0% Bollinger width is also described as normal, meaning the market is not in a compression phase that often precedes a sharp expansion. In other words, the setup does not scream for an explosive move; it suggests a steadier grind unless a catalyst changes the tone.
Volume gives a mixed confirmation. Last volume was 30,909,600, versus a 20-hour average of 27,348,450, or about 1.1× normal. That is supportive, but only modestly so. More telling is that OBV is down. On-balance volume tracks whether trading flow is accumulating or distributing shares; a falling OBV while price rises can mean the rally is not yet backed by broad participation. That does not negate the uptrend, but it does suggest caution about how durable the move may be if buyers step aside.
Key Levels & Scenarios
The nearest technical map is straightforward. 76.01 is the first support level to watch, and 82.73 is the immediate resistance. Beyond that, the Bollinger upper band at 83.92 and the 3-month high at 83.60 define the same neighborhood: this is the zone where the stock must prove it can keep advancing.
If Netflix holds above 79.55 and pushes through 82.73, the chart would improve because price would be clearing resistance while staying above the rising short-term average. If it fails there and slips back under 76.01, the current uptrend would look less secure, especially with OBV already weakening. The middle Bollinger band at 79.55 is also important because losing that level would mean the stock is no longer trading above the short-term consensus price.
The signal is constructive, but not decisive.
Technical Verdict: HOLD (wait & see)
HOLD (wait & see) because:
- Price is above SMA20 and SMA50, and the SMA20 is still rising, which supports the trend.
- MACD histogram is negative, showing momentum is weaker than the price structure implies.
- OBV is down, so the advance is not yet fully confirmed by participation.
Verdict invalidated if price falls below 76.01.
- Ideal Entry Range: 79.55 to 76.01
- Exit Target: 82.73 to 83.92
- Stop Loss protection: below 75.18
In plain English: Netflix is still climbing, but the chart is waiting for stronger proof that the rise has real backing.
Summary Data NFLX
| Last price | 80.32 USD |
| Change 1 day / 5 days / 1 month | 3.77% / 2.65% / 2.76% |
| Trend / MA-cross | uptrend / none |
| SMA20 / SMA50 | 79.55 / 75.75 |
| RSI (14) / Stochastic %K | 55.6 / 61.7 |
| Bollinger %B / ATR | 59% / 2.24 |
| Support / Resistance 20 days | 76.01 / 82.73 |
| Data as of | 14 September 2026 20:30 WIB |


