META Stock Gains 2.71% Today, RSI Overbought
On September 15, 2026: price 665.60 USD, trend sideways, RSI 70.6, support 543.67, resistance 665.60. technical analysis of meta stock.

Meta Platforms climbed to 665.60 USD as of 14 September 2026, up 2.71% on the day and 12.84% over the past month, with the stock now pressing against the top of its recent trading band. The move matters because it is not just a one-day pop: price is sitting above both short- and medium-term averages, yet momentum gauges are flashing that the advance has become stretched. That combination often tells traders the trend is still alive, but the easy part of the rally may already be behind it.
Trend & Price Action
The chart shows Meta trading above the SMA20 at 590.25 and above the SMA50 at 602.56, a constructive setup that usually signals buyers have remained in control over both the short and medium term. There is no fresh MA-cross, which means the market is not getting a new trend-confirmation signal from the moving averages right now; instead, the stock is extending an existing move. The reported trend is still sideways, despite the stronger price action, because the slope of the SMA20 is only 2.32% over 5 days. In plain language, that suggests the stock is rising, but not in a clean, one-direction surge.
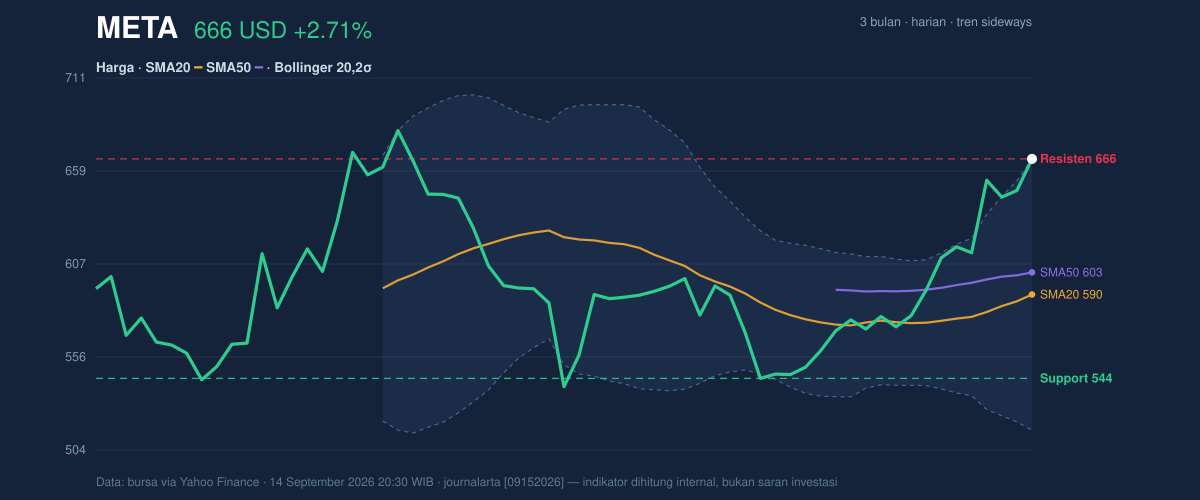
Price is also sitting at the very top of its Bollinger band structure, with the upper band at 665.59 and the last price at 665.60. That is a precise touch of the ceiling, and it usually means the market has fully priced in the current burst of buying for now. The %B reading of 100% confirms that the stock is at the outer edge of its recent statistical range, while the 25.5% band width shows volatility has expanded. In practical terms, the market is no longer quiet; it is capable of larger swings, which can produce either continuation or a sharp pause if momentum cools.
Oscillators & Momentum
The momentum picture is strong, but also overheated. RSI at 70.6 is in overbought territory, which does not mean reversal is automatic, but it does mean the stock has moved far enough, fast enough, that traders may start looking for signs of fatigue. The Stochastic %K at 97.3 and %D at 89.2 reinforce that message: the stock is near the top of its short-term range, and the oscillator is telling us the rally is extended rather than fresh.
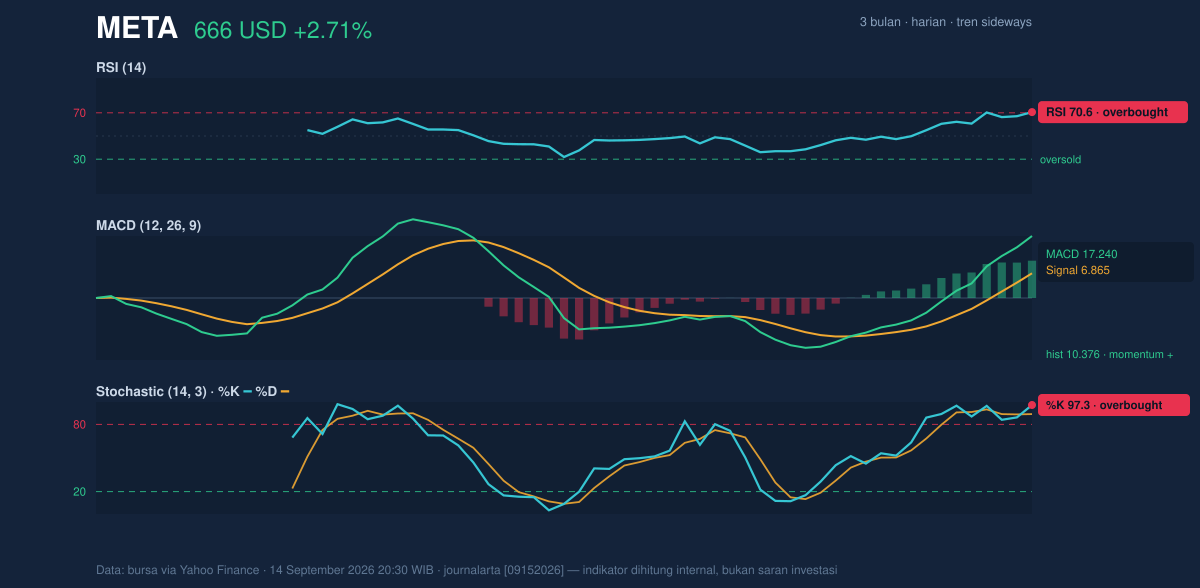
That said, the MACD at 17.240 remains well above the signal line at 6.865, with a histogram of 10.376. This is the clearest evidence that upward momentum is still dominant. MACD is often used to judge whether a trend is gaining or losing force; here, the positive spread shows buyers still have the upper hand. The tension is important: RSI and Stochastic warn of stretch, while MACD says the trend has not yet rolled over. That mix often appears near strong rallies that are still intact, but vulnerable to a consolidation if buying stops accelerating.
Volatility & Volume
The ATR(14) of 21.71, equal to 3.3% of price, points to moderate volatility. This is a useful signal because it suggests Meta can move meaningfully without being chaotic. When volatility is moderate and Bollinger bands are expanding, price can continue traveling in either direction if a catalyst appears; but if momentum fades, the same setup can also produce a swift pullback from the upper band.
Volume adds a supportive note. Last volume was 19,300,300, just above the 20-hour average of 18,422,825, or about 1.0× normal. That is not a dramatic surge, but it is enough to show participation is holding up as the stock tests its highs. The OBV is rising, which matters because On-Balance Volume tracks whether money flow is accumulating with price. Rising OBV alongside a breakout attempt is usually healthier than a price move built on thin trading.
Key Levels & Scenarios
The immediate reference point is the 20-hour resistance at 665.60, which price has already reached, and the nearest support sits at 543.67. The stock is also trading within its 3-month high of 686.08 and 3-month low of 524.49, so it is pushing toward the upper end of that range rather than exploring new territory. That positioning matters: when a stock nears the top of a multi-month range, the market often decides whether the move is a genuine breakout or simply an exhaustion push.
If Meta can hold above the current ceiling, the next test is whether it can sustain trade near the 665.59 upper Bollinger band and keep momentum from fading. If it slips back below the band and loses the recent breakout area, the first sign of cooling would be a drift toward the 590.25 SMA20, which now acts as a key trend gauge. A deeper failure would put the 543.67 support back in focus, where the market would be forced to prove that this rally is more than a short-lived extension.
Technical Verdict: HOLD (wait & see)
The setup is constructive, but the stock is also stretched enough that fresh strength needs confirmation rather than assumption.
- MACD remains strongly positive, showing the trend is still supported by momentum.
- Price above SMA20 and SMA50 keeps the broader structure positive.
- RSI at 70.6 and Stochastic at 97.3/89.2 warn the move is overbought and vulnerable to a pause.
Verdict invalidated if price falls below 543.67, because that would break the nearest cited support and weaken the current trend structure.
- Ideal Entry Range: 590.25 to 602.56
- Exit Target: 665.60 to 686.08
- Stop Loss protection: below 543.67
In plain English: Meta is still strong, but the stock is stretched enough that the next move matters more than the last one.
“We’re not seeing a broken trend — we’re seeing a trend that’s running hot, and the market will have to prove it can keep going from here.”
Summary Data META
| Last price | 665.60 USD |
| Change 1 day / 5 days / 1 month | 2.71% / 7.92% / 12.84% |
| Trend / MA-cross | sideways / none |
| SMA20 / SMA50 | 590.25 / 602.56 |
| RSI (14) / Stochastic %K | 70.6 / 97.3 |
| Bollinger %B / ATR | 100% / 21.71 |
| Support / Resistance 20 days | 543.67 / 665.60 |
| Data as of | 14 September 2026 20:30 WIB |


