PDD Death Cross Pressure: Stock Gains 2.02% (September 15, 2026)
On September 15, 2026: price 79.38 USD, trend downtrend, RSI 36.6, support 77.81, resistance 90.20. technical analysis of pdd stock. PDD Death Cross Pressure —…

PDD Holdings is trading in a fragile pocket of the range: the stock bounced 2.02% to 79.38 USD, but the move still leaves it below its short- and medium-term trend lines, with the chart showing a market that is trying to stabilize without yet proving that sellers have been exhausted.
Trend & Price Action
The most important signal is structural, not just daily. PDD remains in a downtrend, and the slope of SMA20 at -2.78% over 5 days shows the recent average price is still falling, which means rallies have been occurring inside a weakening tape rather than reversing it. The stock is also trading below SMA20 at 84.04 and below SMA50 at 85.59, while the chart shows a death cross — the 20-day average has crossed below the 50-day average. In plain language, that crossover usually signals that recent momentum has deteriorated enough to overtake the broader short-term trend.
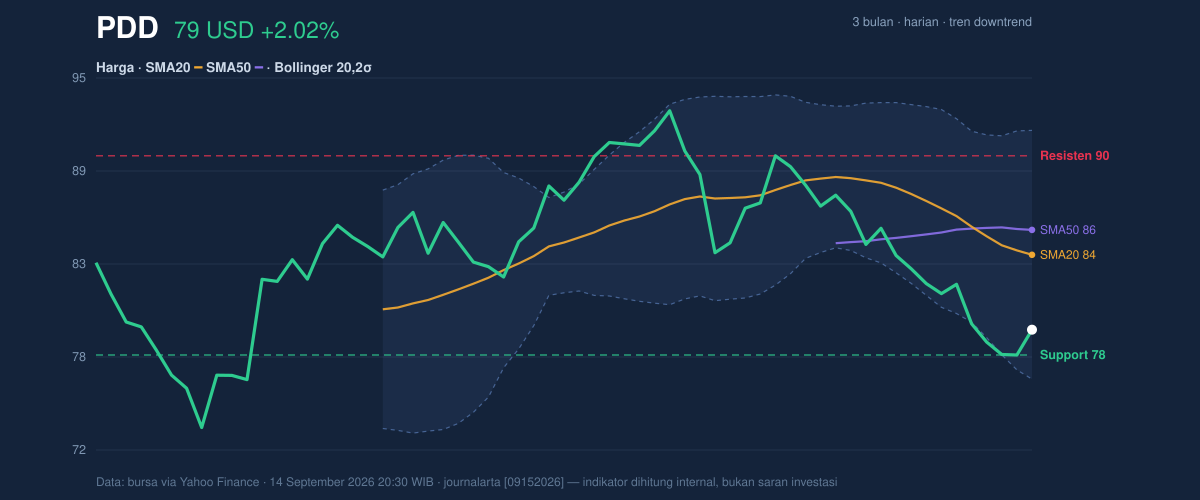
Price is sitting near the lower half of the visible range, with support at 77.81 and resistance at 90.20. That places the stock about 13% into the range, which matters because it suggests PDD is closer to the floor than the ceiling, but not yet at a level where a bounce is confirmed. The 3-month high of 93.19 and 3-month low of 71.94 frame the larger battle: the stock is still materially above the low, yet unable to reclaim the area that would indicate the recent slide has been absorbed.
Oscillators & Momentum
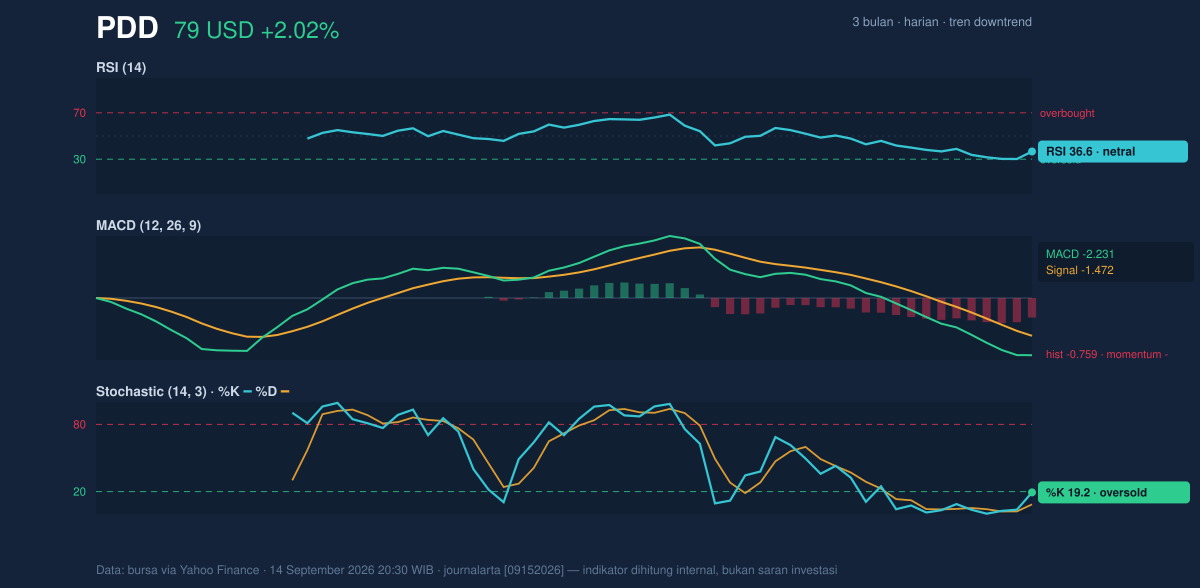
Momentum is mixed, and that mix is the source of the current tension. RSI at 36.6 is technically neutral, but it sits close to the lower end of the range, which means the stock is not deeply oversold, yet it is weak enough that buyers have not regained control. By contrast, the Stochastic %K at 19.2 and %D at 8.6 point to an oversold condition, which often signals that downside may be stretched in the very short term. The key word is “may”: oversold does not mean reversal, only that the stock has been sold hard enough for a rebound attempt to become more plausible.
The MACD at -2.231, with the signal line at -1.472 and histogram at -0.759, keeps the broader momentum message negative. MACD below its signal line means the trend is still losing altitude, and the negative histogram shows that bearish momentum is still expanding rather than fading. So while stochastic hints at a near-term bounce, MACD says the larger force behind the move remains downward. That divergence is often what traders watch for when a stock is trying to form a base, but it is not yet the same as confirmation.
Volatility & Volume
The Bollinger Band setup also supports a cautious reading. With the middle band at 84.04, the stock is below the average price used in the band calculation, and %B at 20% shows PDD is trading in the lower part of its recent volatility envelope. The band width of 18.4% is described as normal, which means the stock is not in a volatility squeeze that would typically precede a sharp breakout. Instead, the market appears to be moving in a controlled decline, with enough room for further movement but without the compression that often builds explosive follow-through.
ATR at 1.89, or 2.4% of price, indicates moderate volatility. That is important because it suggests daily swings are meaningful but not disorderly; the stock can move, but not in a panic-like fashion. Volume adds another caution. Last trading volume of 6,376,800 was below the 20-day average of 7,133,485, at about 0.9× normal, while OBV is falling. In practical terms, that means the latest bounce was not backed by stronger participation, and the cumulative volume trend is still pointing toward distribution rather than accumulation.
Key Levels & Scenarios
The nearest line in the sand is 77.81, the current support and the prior close level. If PDD holds above that area, the chart can continue to attempt a base-building phase, especially because stochastic is already in oversold territory. If it fails, the next reference is the 3-month low at 71.94, which becomes the downside magnet if support gives way.
On the upside, the first meaningful hurdle is the SMA20 at 84.04, then the SMA50 at 85.59, and above that the 90.20 resistance. A move back through the moving averages would matter because it would show the stock is not just bouncing from oversold conditions but is starting to reclaim the trend framework that currently sits overhead. Until that happens, rallies are more likely to be treated as countertrend moves inside a broader decline.
Technical Verdict: HOLD (wait & see)
HOLD (wait & see)
- Death cross and price below SMA20 and SMA50 keep the trend negative.
- MACD remains below signal, showing bearish momentum is still in control.
- Stochastic is oversold, which can support a rebound attempt, but not yet a confirmed reversal.
- Verdict invalidated if price breaks below 77.81, because that would expose the 71.94 low and confirm that support has failed.
- Ideal entry range: 77.81 to 84.04
- Exit target: 85.59 to 90.20
- Stop loss protection: below 77.81
For non-traders, this means the stock is weak but not broken enough to rule out a bounce, and the market still needs proof before the trend can be trusted again.
“Right now, the chart is asking for patience, not conviction.”
Summary Data PDD
| Last price | 79.38 USD |
| Change 1 day / 5 days / 1 month | 2.02% / -3.44% / -6.38% |
| Trend / MA-cross | downtrend / death |
| SMA20 / SMA50 | 84.04 / 85.59 |
| RSI (14) / Stochastic %K | 36.6 / 19.2 |
| Bollinger %B / ATR | 20% / 1.89 |
| Support / Resistance 20 days | 77.81 / 90.20 |
| Data as of | 14 September 2026 20:30 WIB |


