VZ Stock Gains 1.34% Today, Testing Key Resistance
On September 15, 2026: price 51.29 USD, trend uptrend, RSI 66.8, support 48.06, resistance 51.29. technical analysis of vz stock. VZ Stock Gains — full details…

Verizon Communications Inc. climbed to 51.29 USD on the NYSE, up 1.34% from the previous close of 50.61, and the move matters because it leaves the stock pressing against the top of its recent range rather than drifting through the middle of it. The shares are now sitting above both the SMA20 at 49.90 and the SMA50 at 47.10, which tells traders the recent recovery is not just a one-day bounce but part of a broader upward structure. Yet the chart also shows a stock that is close to a decision point: momentum is still constructive on trend, but short-term signals are beginning to look stretched.
Trend & Price Action
The price structure is still clearly positive. Verizon is in an uptrend, and the SMA20 slope of 1.43% over 5 days shows the shorter average is rising at a healthy pace, which usually means buyers have been willing to pay up on successive sessions. With the shares trading above the SMA20 and well above the SMA50, the medium-term message is that the market has moved from recovery into confirmed strength. There is no fresh MA-cross, so the chart is not signaling a new regime change; instead, it is showing continuation of an already-established trend.
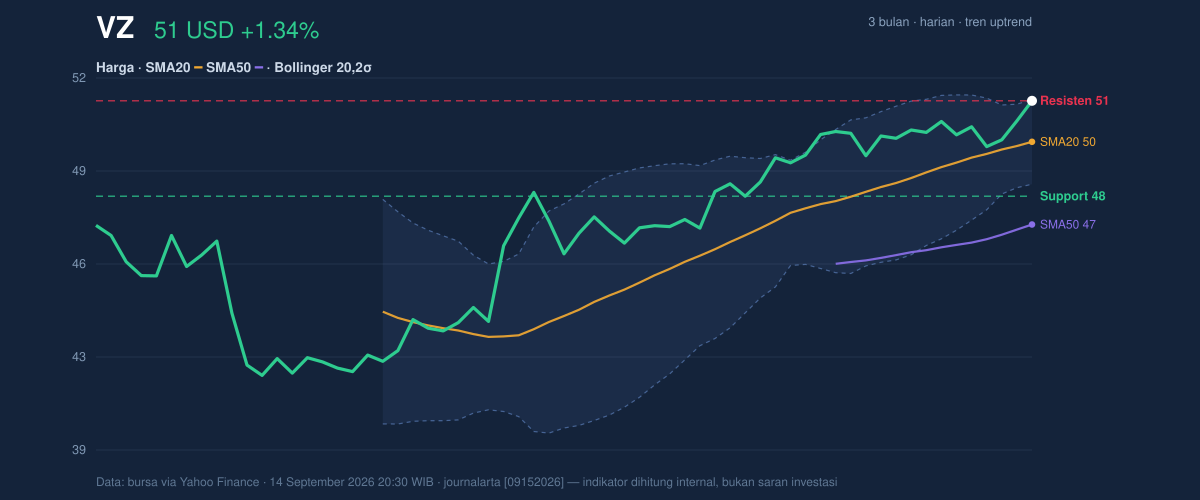
The location inside the range is what makes this interesting. The stock is at 100% of the 20-hour range, essentially at the ceiling, and the 20-hour resistance at 51.29 has been met exactly as the latest price printed. That means the market is testing whether this move has enough sponsorship to keep going, or whether short-term traders will start taking profits into strength. The broader context helps: the 3-month high is 51.49, only slightly above the current price, while the 3-month low is 40.76, showing how much ground the stock has already recovered since the spring weakness.
Oscillators & Momentum
The momentum picture is more mixed than the trend picture. The RSI at 66.8 is still described as neutral, but it sits close to the line where upside can begin to look tired, especially when the stock is already trading near recent highs. In plain English, RSI is not flashing an outright warning, but it is close enough to the upper end of its comfort zone that further gains may need fresh buying to avoid stalling.
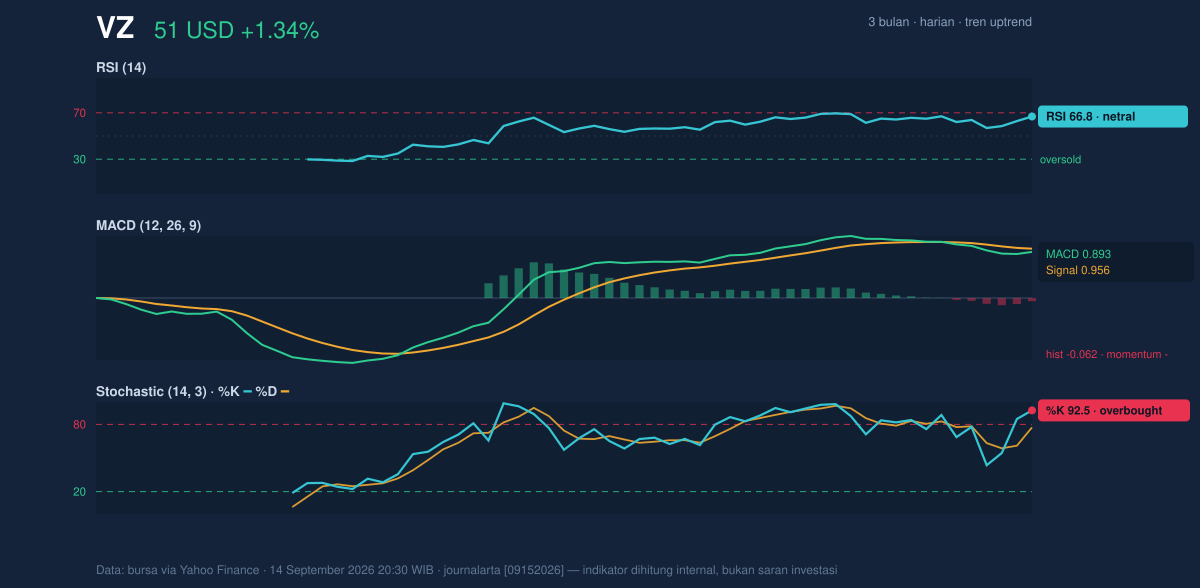
Stochastic is more emphatic. The %K at 92.5 and %D at 77.3 are in overbought territory, which means the stock has risen faster than its own recent trading rhythm. That does not automatically mean a reversal, but it often signals that the easy part of the move may already be behind it. The MACD at 0.893 remains positive in absolute terms, yet the signal line at 0.956 is higher and the histogram at -0.062 is negative, which indicates momentum is losing some force even while the trend itself stays intact. That combination is important: the chart is not bearish, but it is no longer accelerating with the same conviction.
Volatility & Volume
Bollinger Bands add another layer to the setup. The upper band at 51.34 is almost exactly where the price is trading, and the %B at 98% shows Verizon is hugging the top of its volatility envelope. That usually means the stock is extended in the short term, though not necessarily over. More notable is the band width of 5.8%, which is described as a squeeze. A squeeze matters because it often precedes a larger move; the market is compressing energy, and when compression meets a price already sitting near resistance, the next move can be sharp in either direction.
Volume supports the move, but only modestly. The latest 18,116,700 shares traded are about 1.0× normal versus the 20-hour average of 17,567,095, so this is not a breakout powered by obvious volume expansion. Still, OBV is rising, which means cumulative volume has been leaning in the same direction as price. In practical terms, buyers have been present often enough to keep the trend alive, even if the latest push has not yet attracted a surge of participation. The ATR at 0.84, equal to 1.6% of price, suggests volatility is moderate, so moves can still extend without needing extreme daily swings.
Key Levels & Scenarios
The nearest line in the sand is the 51.29 resistance, which the stock is now pressing against. A clean move above the 51.34 upper Bollinger band would suggest the squeeze is resolving upward and that the market is willing to price in a fresh leg higher. If that fails, the first area to watch is the 48.06 support, which sits below the SMA20 at 49.90 and would indicate a loss of short-term momentum if tested. Because the price is already at the top of the recent range, a slip back under the moving average would not erase the broader uptrend immediately, but it would show that the latest advance has run ahead of itself.
The setup is therefore less about chasing a breakout and more about whether the stock can convert its position at the top of the range into a sustained push. The chart is giving traders a simple message: strength is present, but it is now being asked to prove itself.
Technical Verdict: HOLD (wait & see)
HOLD (wait & see)
- Reason 1: The trend is still constructive, with price above the SMA20 at 49.90 and SMA50 at 47.10, and the SMA20 slope still rising.
- Reason 2: Momentum is stretched: Stochastic %K 92.5 / %D 77.3 is overbought, while the MACD histogram -0.062 shows fading upside force.
- Reason 3: The price is at the 20-hour resistance of 51.29 and near the upper Bollinger band at 51.34, so the stock is extended at a likely inflection point.
- Verdict invalidated if price breaks below 48.06, because that would undercut the key short-term support and weaken the current trend structure.
- Ideal Entry Range: 49.90 to 48.47
- Exit Target: 51.34 to 51.49
- Stop Loss protection: 48.06
For non-traders, that means Verizon is still strong, but the chart is close enough to resistance that the next move needs confirmation rather than assumption.
Verizon’s next test is whether the squeeze near the top of the Bollinger range turns into a breakout or simply a pause, and the answer will likely start with 51.34.
Summary Data VZ
| Last price | 51.29 USD |
| Change 1 day / 5 days / 1 month | 1.34% / 2.29% / 5.80% |
| Trend / MA-cross | uptrend / none |
| SMA20 / SMA50 | 49.90 / 47.10 |
| RSI (14) / Stochastic %K | 66.8 / 92.5 |
| Bollinger %B / ATR | 98% / 0.84 |
| Support / Resistance 20 days | 48.06 / 51.29 |
| Data as of | 14 September 2026 20:30 WIB |


