WMT Stock Technicals Today: Gains 1.80%, Momentum Gains
On September 15, 2026: price 109.08 USD, trend sideways, RSI 52.3, support 102.63, resistance 115.20. technical analysis of wmt stock. WMT Stock Technicals —…

Walmart is holding a middle lane between recent weakness and a still-intact longer base, with traders watching whether the stock can turn a modest rebound into something more durable. On the New York Stock Exchange, WMT last traded at 109.08 USD, up 1.80% on the day, but still -5.37% over one month, which matters because it shows the latest bounce is happening inside a broader cooling phase rather than a clean breakout.
Trend & Price Action
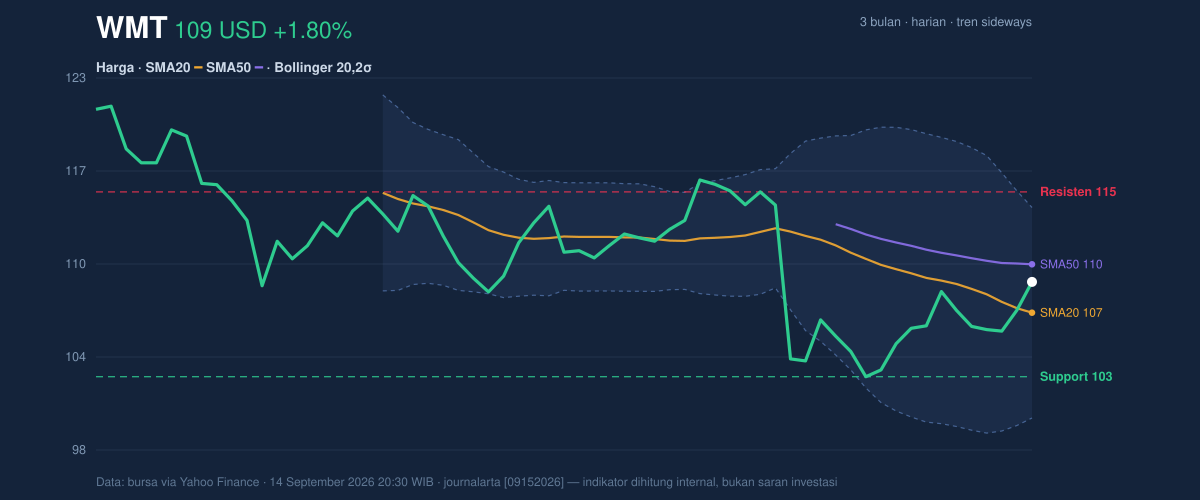
As shown in the chart, the stock is still described as sideways, and that is the key reading for international investors: this is not a strong trend market right now, but a range market where direction is being negotiated. Price is above SMA20 at 106.98, which usually signals that short-term selling pressure has eased. But it remains below SMA50 at 110.28, so the medium-term trend has not fully flipped back in favor of buyers.
That gap between the two moving averages is important. When price sits above the faster average but below the slower one, it often means momentum has improved from weak to neutral, yet the market still needs proof before a broader trend change is accepted. There is also no fresh MA-cross, so the chart is not giving a clean trend-reversal signal; it is more of a waiting pattern than a decisive turn.
The stock is also trading at about 51% of its 20-hour range, which reinforces the idea that it is sitting near the middle of the battlefield rather than near a clear breakout point. The 3-month high of 122.94 and 3-month low of 102.15 frame the larger range, and the current price is still much closer to the lower end than the high, even after the day’s advance.
Oscillators & Momentum
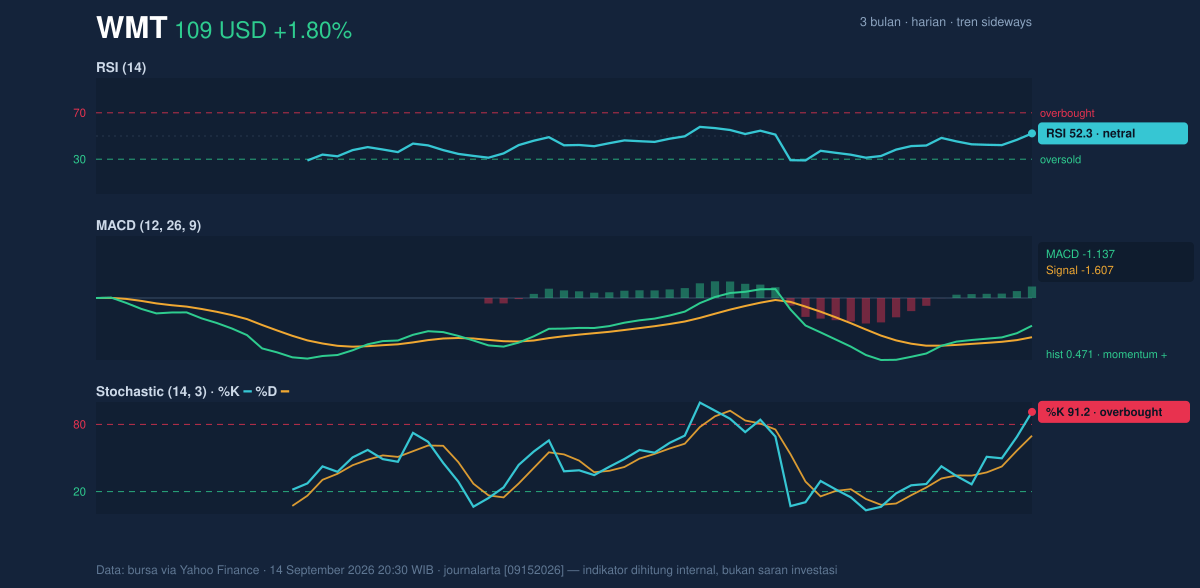
The momentum picture is mixed, and that mix explains why the stock can rise on a day without yet looking fully repaired. RSI at 52.3 is neutral, which means the stock is neither stretched nor washed out. In plain language, the market is not overexcited, but it is also not showing the kind of heavy pessimism that often precedes a stronger rebound.
The sharper signal comes from stochastics. Stochastic %K at 91.2 and %D at 69.9 place the stock in overbought territory, meaning the recent push has been fast enough that short-term traders may already have crowded into the move. That does not automatically mean reversal, but it often warns that upside may need a pause before it can extend.
The MACD setup is more constructive. MACD at -1.137 is still below zero, so the longer momentum backdrop is not fully bullish, but the signal line at -1.607 and the positive histogram at 0.471 show the gap is closing in a favorable direction. In practical terms, this means downside momentum is fading and the stock is trying to build upward pressure from a weak base rather than from strength already established.
Volatility & Volume
Volatility is neither compressed to the point of a breakout spring nor stretched into panic. ATR(14) at 1.88, or 1.7% of price, points to moderate volatility, which implies the stock can move, but not in a disorderly way. The Bollinger Bands reinforce that reading: the band width is 13.4%, described as normal, so there is no strong squeeze hinting at an imminent explosive move.
The position inside the bands matters. %B at 65% means price is above the midpoint of the Bollinger envelope but not near the upper edge. That is a constructive placement: it suggests recovery, yet leaves room before the chart becomes technically extended. The upper band at 114.14 and lower band at 99.82 give the market a visible operating corridor.
Volume, however, is not confirming the day’s price gain with force. Last volume was 23,877,400, below the 20-hour average of 28,262,445, or about 0.8× normal. That means the advance came on lighter participation than usual, which can make a rally less convincing. Still, OBV is rising, and that is a useful counterpoint: on-balance volume tracks whether money has been accumulating over time, so a rising OBV suggests the broader flow is improving even if the latest session was not heavily traded.
Key Levels & Scenarios
The chart’s most important reference points are clear. Support at 102.63 sits just above the 3-month low of 102.15, making that area the first line of defense if the rebound fades. On the upside, Resistance at 115.20 is the first major barrier, and it stands just above the Bollinger upper band at 114.14. That combination is meaningful because it suggests the market would need both price follow-through and band expansion to convincingly move beyond the current range.
If price remains above 106.98 and can challenge 110.28, the chart would begin to look more balanced, with the next test being the 114.14 to 115.20 zone. If it fails to hold 102.63, the structure weakens quickly because the market would be slipping back toward the lower edge of the recent range near 102.15 and then toward 99.82.
Technical Verdict: HOLD (wait & see)
HOLD (wait & see) is the clearest technical reading here.
- RSI at 52.3 is neutral, so the stock is not yet showing a strong directional edge.
- MACD histogram at 0.471 is positive, which supports recovery, but MACD remains below zero at -1.137, so the trend is not fully repaired.
- Stochastic %K at 91.2 is overbought, warning that the short-term bounce may be stretched.
- Price above SMA20 at 106.98 is constructive, but below SMA50 at 110.28 keeps the medium-term picture incomplete.
- Volume at 0.8× normal limits the strength of the day’s advance, even though OBV is rising.
- Verdict invalidated if price falls below 102.63, which would weaken the range floor and reopen the path toward the lower band near 99.82.
- Ideal entry range: 106.98 to 110.28
- Exit target: 114.14 to 115.20
- Stop loss protection: below 102.63
In plain English, the chart says Walmart is improving, but it has not yet proven that the rebound is strong enough to call a fresh trend.
Summary Data WMT
| Last price | 109.08 USD |
| Change 1 day / 5 days / 1 month | 1.80% / 1.81% / -5.37% |
| Trend / MA-cross | sideways / none |
| SMA20 / SMA50 | 106.98 / 110.28 |
| RSI (14) / Stochastic %K | 52.3 / 91.2 |
| Bollinger %B / ATR | 65% / 1.88 |
| Support / Resistance 20 days | 102.63 / 115.20 |
| Data as of | 14 September 2026 20:30 WIB |


