T Stock Gains 1.73%, Testing Key Resistance In Focus
On September 15, 2026: price 26.51 USD, trend uptrend, RSI 65.6, support 24.68, resistance 26.51. technical analysis of t stock. Stock Gains — full details…

AT&T closed at 26.51 USD, up 1.73% on the day and sitting right at the top of its recent trading band. That matters because the stock is no longer just drifting higher; it is pressing against resistance while momentum tools begin to disagree with the price action.
Trend & Price Action
The broad setup still leans constructive. AT&T is trading above its SMA20 at 25.62 and well above its SMA50 at 23.98, which tells the market is paying a premium for the shares in the short-to-medium term. The SMA20 slope of 1.30% over 5 days shows the short-term trend is still rising rather than flattening out.
But the interesting part is where the stock is trading, not just the direction. As shown in the chart, the price is at 100% of the 20-hour range and exactly at 20-hour resistance of 26.51, while the 3-month high is 26.62. That places AT&T in a narrow zone where buyers have already done most of the work, and the next move depends on whether they can force a clean break into new highs or whether the stock pauses and digests gains.
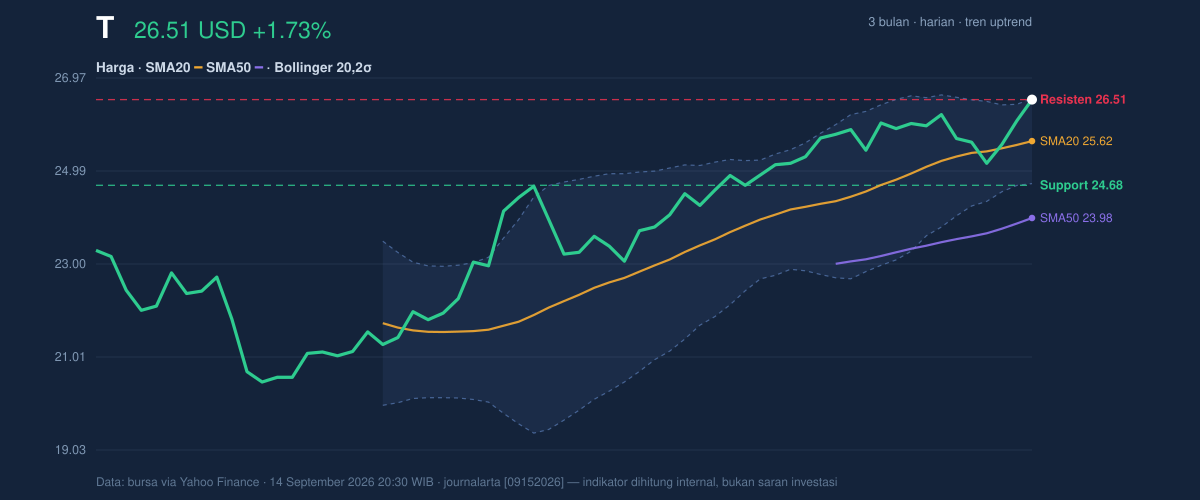
The Bollinger Bands reinforce that tension. Price is at %B 99%, meaning it is trading almost at the upper band, 26.53. In plain English, the stock is stretched toward the top of its recent volatility envelope. Yet the 7.1% band width is squeezing, which often signals that a larger move may be building. A squeeze does not tell direction; it tells you the market is coiling. Here, the coil is happening after a steady advance, so the next breakout attempt matters more than the recent climb itself.
Oscillators & Momentum
The momentum picture is less clean than the price chart. RSI at 65.6 is still technically neutral, but it is close enough to the upper end of the range to show the stock is getting extended. More telling is the Stochastic reading: %K at 94.0 and %D at 72.2. That is an overbought signal, and it usually means the latest rise has moved faster than the underlying trend can comfortably absorb.
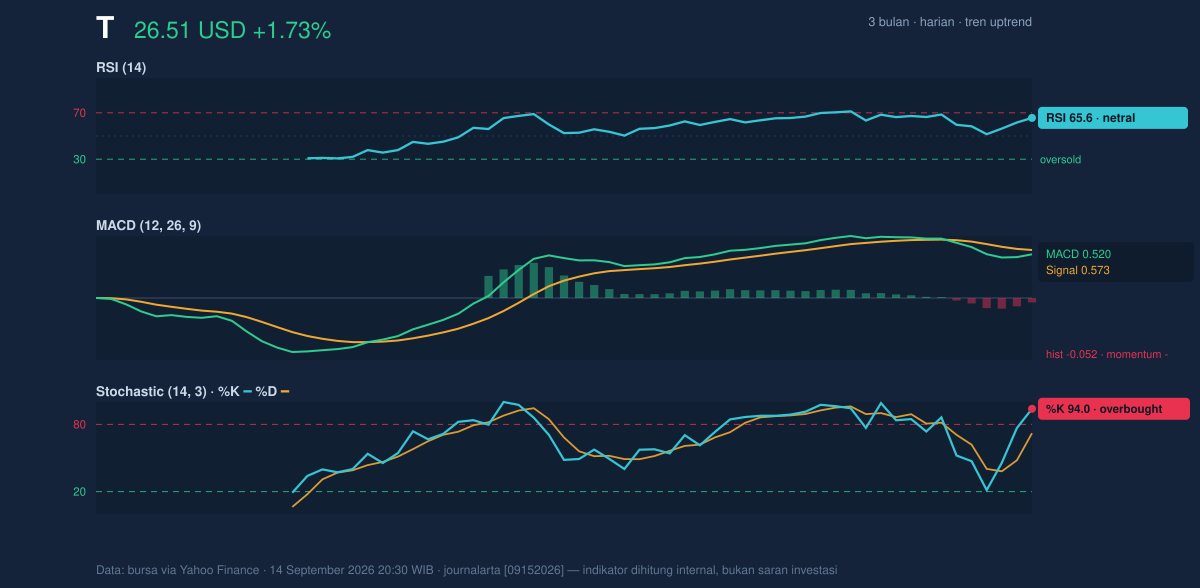
The MACD is the sharper warning. MACD at 0.520 remains above zero, which keeps the broader trend alive, but it sits below the signal line at 0.573 and the histogram is -0.052. That negative histogram means upward momentum is fading even while price is near highs. In other words, the stock is still rising, but the internal push behind the rise is weakening. When that happens near resistance, traders often shift from chasing strength to waiting for confirmation.
Volatility & Volume
Volatility is not extreme, but it is active enough to matter. The ATR(14) of 0.53 equals about 2.0% of price, which suggests ordinary daily swings are moderate rather than chaotic. That gives the stock room to move without signaling distress.
Volume adds a second layer. Last trade volume was 38,499,400, above the 20-hour average of 32,851,720, or about 1.2x normal. Higher volume during a push toward resistance usually indicates real participation, not just thin trading. But the OBV is down, and that divergence matters: On-Balance Volume tracks whether volume is flowing with price over time. A falling OBV while price rises often suggests the advance is not being broadly confirmed by accumulation. That does not automatically reverse the trend, but it does argue for caution when the stock is already stretched.
Key Levels & Scenarios
The market is now focused on a very tight set of levels. The nearest support is 24.68, and the nearest resistance is 26.51, with the 3-month high at 26.62 just above that. The current price is effectively sitting on the ceiling.
If AT&T can clear 26.51 and then move through 26.62, the chart would confirm that the squeeze has resolved upward and that buyers were able to absorb the overbought condition. If it fails here, the first area to watch is the 25.62 SMA20, which is both the Bollinger middle band and a short-term trend line in disguise. A deeper pullback would bring 24.72 into view at the lower Bollinger band, followed by 24.68 support.
The key signal is not just whether the stock is up, but whether it can stay up without momentum breaking underneath it.
Technical Verdict: HOLD (wait & see)
- Reason 1: Price is still in an uptrend and above both the SMA20 and SMA50, which keeps the larger structure constructive.
- Reason 2: Stochastic is overbought and MACD histogram is negative, showing momentum is no longer fully confirming the price move.
- Reason 3: The stock is pressing upper Bollinger resistance with %B at 99%, so the chart is extended even though the band squeeze hints at a possible breakout.
- Invalidation: This verdict is invalidated if price falls below 24.68, which would mean near-term support has failed.
- Ideal Entry Range: 25.62 to 24.72
- Exit Target: 26.62
- Stop Loss protection: 24.68
In plain English: the stock still looks healthy, but it is now close enough to resistance that the next move needs proof, not enthusiasm.
“We are watching whether the market can turn a tight squeeze into a real breakout, or whether the last push simply runs out of room at the top.”
Summary Data T
| Last price | 26.51 USD |
| Change 1 day / 5 days / 1 month | 1.73% / 3.23% / 6.51% |
| Trend / MA-cross | uptrend / none |
| SMA20 / SMA50 | 25.62 / 23.98 |
| RSI (14) / Stochastic %K | 65.6 / 94.0 |
| Bollinger %B / ATR | 99% / 0.53 |
| Support / Resistance 20 days | 24.68 / 26.51 |
| Data as of | 14 September 2026 20:30 WIB |


