NFLX Stock Gains 0.53%, Momentum Weakens In Focus
On Juli 24, 2026: price 68.89 USD, trend downtrend, RSI 33.6, support 67.60, resistance 77.65. technical analysis of nflx stock. NFLX Stock Gains — full…

Netflix Inc. on NASDAQ slipped to 68.89 USD in the latest session, up 0.53% on the day but still down 7.34% over 5 days and 4.11% over 1 month, according to Yahoo Finance data via the exchange feed. That combination matters: a small daily rebound inside a broader slide usually says the market is still testing whether the recent selloff is a pause or just a brief bounce. The stock is now trading well below both its 72.82 20-day average and 79.05 50-day average, which keeps the tape tilted lower.
Trend & Price Action
The chart shows Netflix remains in a clear downtrend, with the 20-day moving average sloping down -1.97% over the past 5 days. That slope is not just a statistic; it means recent prices have been falling fast enough that the short-term trend itself is still pointing lower, rather than flattening into a base. With price sitting below SMA20 and far under SMA50, the stock has not yet reclaimed the levels that often mark a shift from corrective trading to stabilization. There is also no fresh MA-cross, so there is no new moving-average signal suggesting a trend reversal.
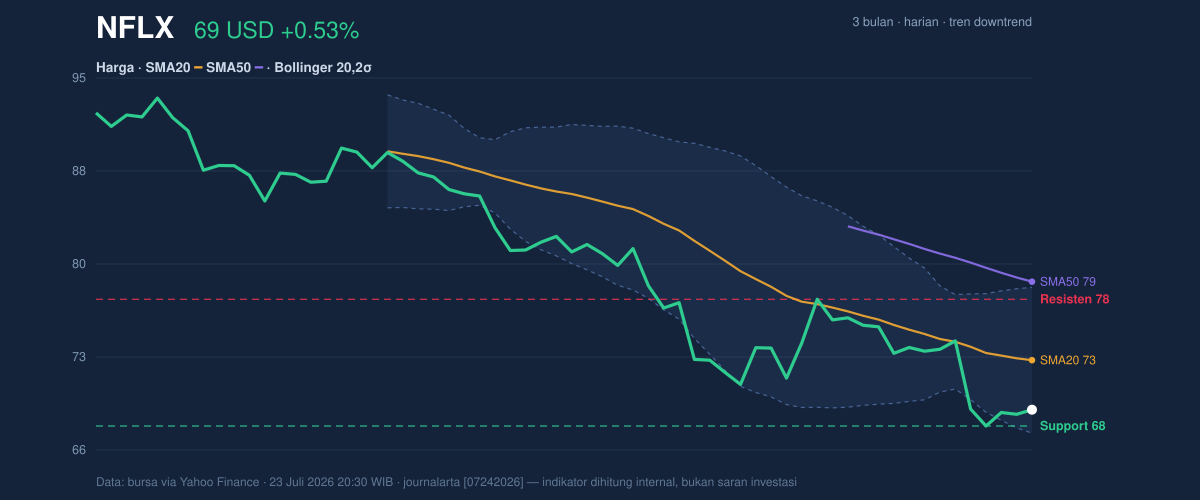
The broader position in the range is also weak. At 68.89 USD, Netflix is trading near the lower end of the 67.60 to 77.65 20-hour support-resistance band, at roughly 13% of that range from the bottom. That tells us buyers have not yet regained control. The stock is still above the 3-month low of 65.08, but the gap is not large enough to imply comfort; it is close enough that any loss of nearby support could quickly reopen that lower zone. Short sentence: the chart is still leaning down.
Oscillators & Momentum
Momentum indicators are mixed, but not in a way that yet supports a durable reversal. The RSI at 33.6 is technically neutral, but it sits close to the oversold zone, which means selling pressure has been strong enough to stretch the stock lower without fully washing it out. The Stochastic %K at 29.1 and %D at 27.3 are also neutral, but near the lower end of their range; in plain English, that suggests the stock has been weak for long enough that it could bounce, but it has not shown the kind of upward turn that would confirm a recovery.
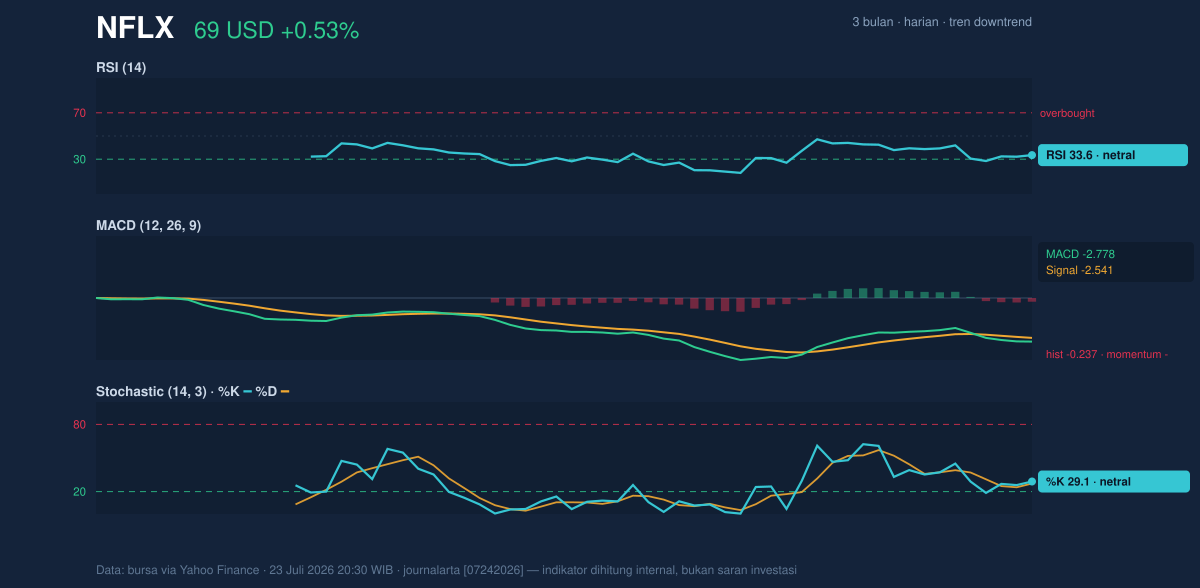
The more important signal is the MACD at -2.778, still below its -2.541 signal line with a -0.237 histogram. MACD measures whether short-term momentum is improving or worsening; when it stays below the signal line, it usually means the recent trend remains under pressure. So while RSI and Stochastic are no longer deeply bearish, MACD says the downside trend has not yet been neutralized. That mix often produces choppy trading rather than a clean trend change.
Volatility & Volume
Bollinger Bands help frame where price sits relative to its recent statistical range, and Netflix is near the lower edge. The %B of 16% means the shares are trading close to the lower band at 67.04, not near the middle band at 72.82 or upper band at 78.60. That is a sign of weakness, but it can also mean the stock is stretched enough for a reflex bounce if sellers pause. The band width is 15.9%, described as normal, so this is not a volatility squeeze waiting to explode; instead, it suggests the stock is already moving within a fairly standard range.
Volatility itself is elevated. The ATR of 2.55, equal to 3.7% of price, means daily swings remain large enough that short-term moves can travel quickly through support or resistance. Volume adds an important caution: the latest turnover of 44,985,200 was only 0.9x the 20-hour average of 51,704,150, and OBV is falling. OBV, or on-balance volume, tracks whether volume is flowing into or out of the stock; a decline there means the recent price weakness has broad participation rather than being a thin, low-liquidity move. That reduces the odds of a quick, clean reversal without stronger demand showing up first. Short sentence: the tape still lacks proof of accumulation.
Key Levels & Scenarios
The nearest level that matters is 67.60, the 20-hour support. It sits just above the lower Bollinger band at 67.04, so it is effectively the first line of defense for the current trade. If that floor fails, the chart points back toward the 3-month low at 65.08, where buyers last managed to slow the decline. On the upside, 72.82 is the first major checkpoint because it is both the Bollinger middle band and the 20-day average; reclaiming that area would suggest the stock is at least trying to move out of the weak zone. Above that, 77.65 is the next resistance, and then 79.05, the 50-day average, which often acts like a ceiling when a stock is still in a downtrend.
The practical signal is simple: holding 67.60 keeps the possibility of a bounce alive, but only a move back above 72.82 would begin to change the short-term tone. For now, the stock is still trading in the lower part of its recent structure.
Technical Verdict: HOLD (wait & see)
HOLD (wait & see) — the chart is weak, but not yet broken enough to justify a decisive directional call from the data alone.
- MACD remains negative and below its signal line, showing downside momentum is still active.
- Price is below SMA20 and SMA50, while the 20-day average is still sloping lower, which keeps the trend bearish.
- %B at 16% and RSI near oversold territory suggest the stock is stretched, so a reflex bounce is possible, but not confirmed.
Verdict invalidated if price breaks 67.60; that would expose the 65.08 3-month low more directly.
- Ideal Entry Range: 67.60 to 72.82
- Exit Target (Target Price): 77.65 to 79.05
- Stop Loss protection: below 67.04, with added caution if 65.08 is breached
In plain English: Netflix is still under pressure, but the chart is close enough to support that it could either stabilize or slip further, and the next move likely depends on whether 67.60 holds.
Summary Data NFLX
| Last price | 68.89 USD |
| Change 1 day / 5 days / 1 month | 0.53% / -7.34% / -4.11% |
| Trend / MA-cross | downtrend / none |
| SMA20 / SMA50 | 72.82 / 79.05 |
| RSI (14) / Stochastic %K | 33.6 / 29.1 |
| Bollinger %B / ATR | 16% / 2.55 |
| Support / Resistance 20 days | 67.60 / 77.65 |
| Data as of | 23 Juli 2026 20:30 WIB |


