Alibaba Stock Drops 3.56%, Momentum Gains In Focus
On Agustus 14, 2026: price 121.90 HKD, trend uptrend, RSI 57.4, support 110.00, resistance 128.10. technical analysis of alibaba stock.

Alibaba Group’s Hong Kong-listed shares fell to HKD 121.90 on 12 August 2026, a 3.56% drop from the previous close of HKD 126.40, even as the broader technical picture still points to an uptrend. The move leaves the stock above its short- and medium-term trend lines, but it also shows that recent buyers are no longer paying up as aggressively as they were a month ago. As shown in the chart, the current pullback is happening inside a still-intact rising structure rather than at the start of a clean breakdown.
Trend & Price Action
The most important signal is that Alibaba remains above both SMA20 at HKD 118.51 and SMA50 at HKD 111.63, which means the share price is still trading above the average levels watched by short- and medium-term market participants. In plain terms, that usually suggests the trend has not been damaged yet. The slope of the SMA20, up 3.08% over 5 days, reinforces that point: the recent average is still rising, so the baseline trend is higher even though the last session was weaker. There is no new MA-cross, which matters because a fresh crossover often signals a stronger shift in trend; without it, the chart is still in a continuation phase rather than a confirmed reversal.
The price is also sitting at 66% of the 20-hour range, between support at HKD 110.00 and resistance at HKD 128.10. That puts Alibaba in the upper half of its recent band, but not yet at the ceiling. The stock is still far below its 3-month high of HKD 144.00 and well above its 3-month low of HKD 88.65, which tells readers the recovery from the lower end of the range has been meaningful, though not complete.
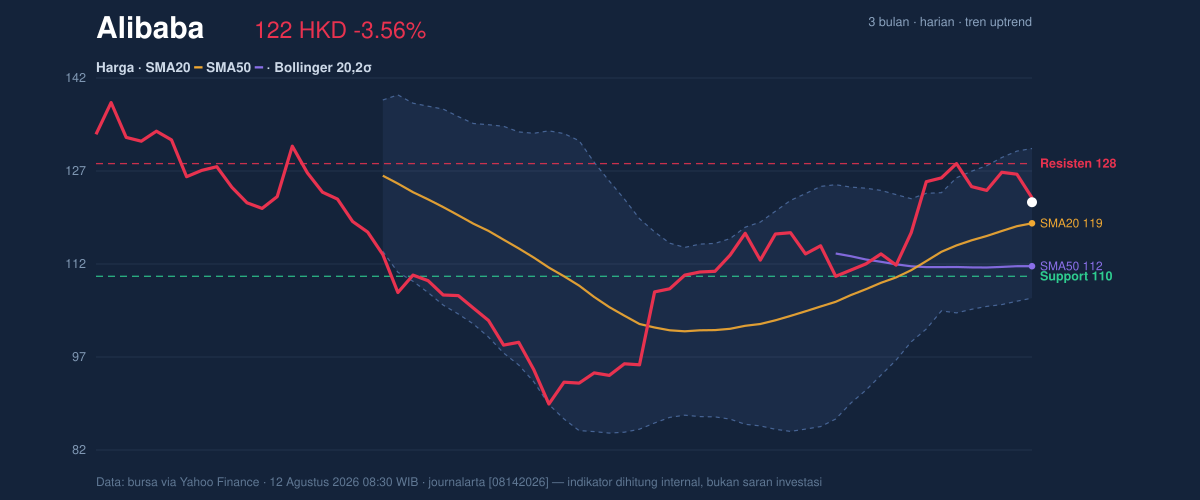
A rising trend with a one-day setback is not the same as a trend break.
Oscillators & Momentum
The momentum tools are more mixed than the trend lines. RSI at 57.4 is neutral, which means the stock is neither stretched enough to look overheated nor weak enough to look washed out. That is a useful signal: it suggests the recent drop has not yet pushed Alibaba into an oversold condition, so the market is not showing panic. The Stochastic reading of %K 65.2 and %D 78.5 is also neutral, but with %K below %D, short-term momentum has cooled from its stronger level. Stochastic often turns before price does, so this gap hints that the stock may need fresh buying to re-accelerate.
The cleaner signal comes from MACD at 4.194 versus its signal line at 3.499, with a positive histogram of 0.695. For general readers, MACD compares short- and longer-term price momentum; when it stays above the signal line, it usually means the trend still has positive force behind it. In Alibaba’s case, that positive histogram offsets the softer daily price action and argues that the recent decline is more of a pause than a confirmed momentum failure.
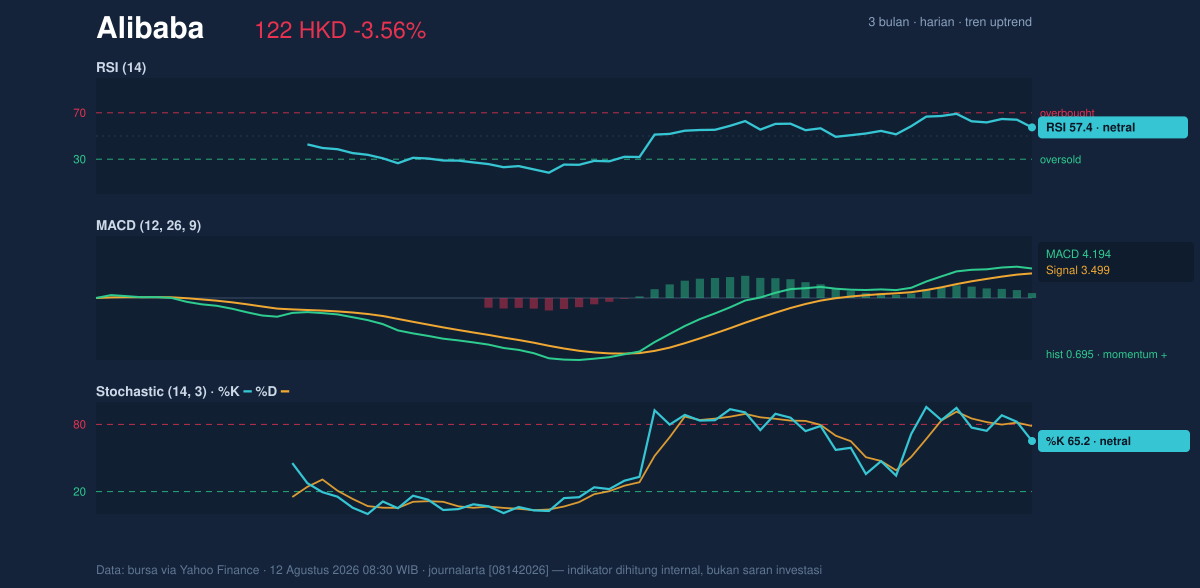
Momentum has cooled, but it has not turned negative.
Volatility & Volume
Volatility is elevated. The Bollinger Bands are wide, with the upper band at HKD 130.52 and the lower band at HKD 106.50, while the band width of 20.3% shows the range has expanded. Wider bands typically mean the market is expecting bigger swings, not a quiet drift. The %B reading of 64% places the stock above the middle line but below the upper band, which is consistent with a market that is still constructive but has not yet broken into the top of its range. In that setting, sharp moves in either direction become more likely.
Volume, however, did not confirm the selloff. Last session volume was 65,057,854, below the 20-day average of 97,962,021, or about 0.7x normal. That matters because a heavy drop on strong volume would suggest stronger conviction from sellers. Instead, the lighter turnover implies the decline was not backed by broad participation. The OBV is rising, which is another constructive sign: on-balance volume tracks whether trading pressure is accumulating over time, and a rising line usually means buyers have been more active than the price alone suggests.
The chart says volatility is high, but the volume did not scream capitulation.
Key Levels & Scenarios
The nearest battleground remains support at HKD 118.51, which is also the SMA20. Because the price is still above that level, the short-term trend remains intact. If the stock slips below that zone, the next important floor is HKD 110.00, where the 20-hour support sits. On the upside, the first obstacle is HKD 128.10; above that, the next technical ceiling is the Bollinger upper band at HKD 130.52. A move through that area would indicate the market is willing to pay higher prices again after the recent pullback.
The current setup is therefore defined by a narrow question: can Alibaba hold above its rising average and re-test resistance, or does the pullback deepen toward the lower support zone? The answer will likely come from how the stock behaves around the HKD 118.51 area, not from the one-day drop alone.
Technical Verdict: HOLD (wait & see)
HOLD (wait & see) because the chart is still technically constructive, but the latest decline shows enough hesitation to avoid calling the move fully resolved.
- MACD remains positive with the histogram above zero, so trend momentum is still intact.
- Price is above SMA20 and SMA50, and the SMA20 is rising, which supports the broader uptrend.
- RSI and Stochastic are neutral, so the stock is not oversold enough to strongly imply an immediate rebound, while volatility is elevated.
Verdict invalidated if price falls below HKD 110.00, because that would break the nearest support zone and weaken the current trend structure.
- Ideal Entry Range: HKD 118.51 to HKD 121.90
- Exit Target: HKD 128.10 to HKD 130.52
- Stop Loss protection: below HKD 110.00
For non-traders: Alibaba’s chart still looks healthier than damaged, but it needs to prove the recent drop was only a pause.
Last session volume was 65,057,854, below the 20-day average of 97,962,021.
Summary Data Alibaba
| Last price | 121.90 HKD |
| Change 1 day / 5 days / 1 month | -3.56% / -4.84% / 7.50% |
| Trend / MA-cross | uptrend / none |
| SMA20 / SMA50 | 118.51 / 111.63 |
| RSI (14) / Stochastic %K | 57.4 / 65.2 |
| Bollinger %B / ATR | 64% / 4.80 |
| Support / Resistance 20 days | 110.00 / 128.10 |
| Data as of | 12 Agustus 2026 08:30 WIB |



