Tencent Stock Analysis: Drops 6.33%, Testing Support Level
On Agustus 14, 2026: price 441.00 HKD, trend sideways, RSI 47.9, support 434.60, resistance 492.20. technical analysis of tencent stock.

Tencent Holdings fell sharply on the Hong Kong exchange on 12 August 2026, with 0700.HK last changing hands at 441.00 HKD after a 6.33% one-day drop, according to Yahoo Finance data sourced from the bourse. The move leaves the stock below both its short- and medium-term trend markers, but not yet in a full breakdown: price is sitting just above the lower Bollinger Band and inside a broad sideways range, which means the market is still deciding whether this is a routine pullback or the start of a deeper reset.
Trend & Price Action
Tencent’s chart is now telling a more cautious story than it was a few sessions ago. The share price is below the SMA20 at 468.17 and also below the SMA50 at 456.66, which signals that recent trading has weakened enough to slip under both the short-term and intermediate trend averages. That matters because moving averages often act as the market’s memory: when price falls beneath them, buyers who were comfortable higher up are suddenly underwater, and rallies tend to face selling pressure as those holders look to reduce exposure.
Still, the structure is not a clean downtrend. The data show a sideways trend with the SMA20 slope at 0.58% over 5 days, suggesting the broader consolidation had been relatively stable before the latest drop. In other words, the chart has not yet fully abandoned its range-bound character — it has simply moved to the lower edge of that range. The current price is only 11% of the way up the 20-day support-to-resistance band, which is a technical way of saying Tencent is trading close to the lower boundary rather than near the top of the recent range.
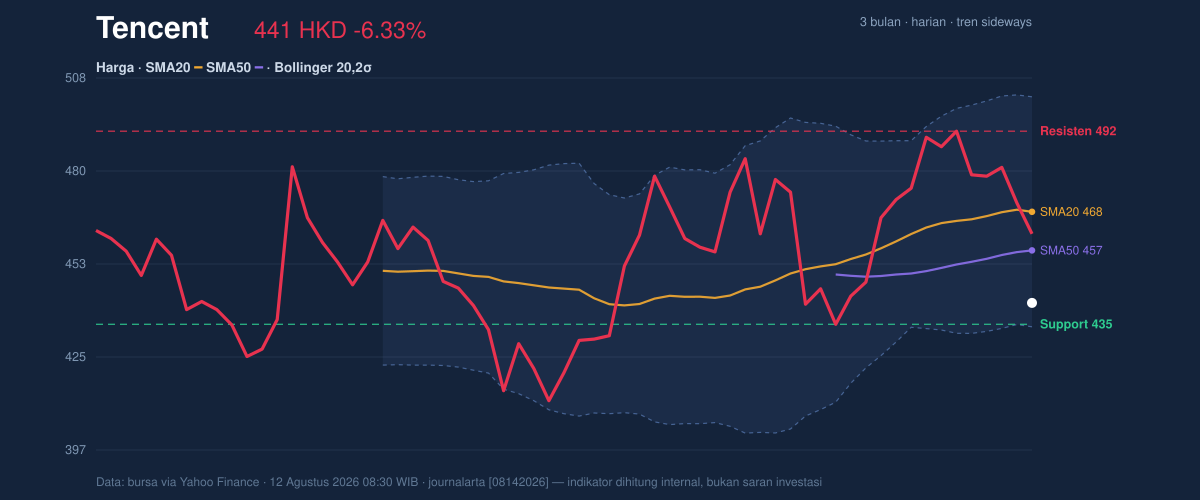
The key message from the price action is simple: 441.00 HKD is testing the market’s patience near support, not confirming a rebound.
Oscillators & Momentum
The momentum indicators are mixed, which is often what you see when a stock is correcting but has not yet fully broken trend. The RSI(14) at 47.9 is neutral, neither oversold nor overbought. That means the selloff has not yet reached an extreme that typically invites aggressive bargain hunting. The Stochastic %K at 45.0 and %D at 59.7 is also neutral, but the gap between the two lines suggests near-term momentum has softened and is still working through the downside.
The more important signal is from MACD. Tencent’s MACD at 5.899 is below the signal line at 6.664, with a histogram of -0.765. That negative histogram is the market’s way of saying downside momentum is currently stronger than the underlying trend impulse. It does not automatically mean a major bear phase, but it does mean any bounce will need proof rather than assumption. In practical terms, the stock is not yet showing the kind of oscillator alignment that usually supports a clean reversal.
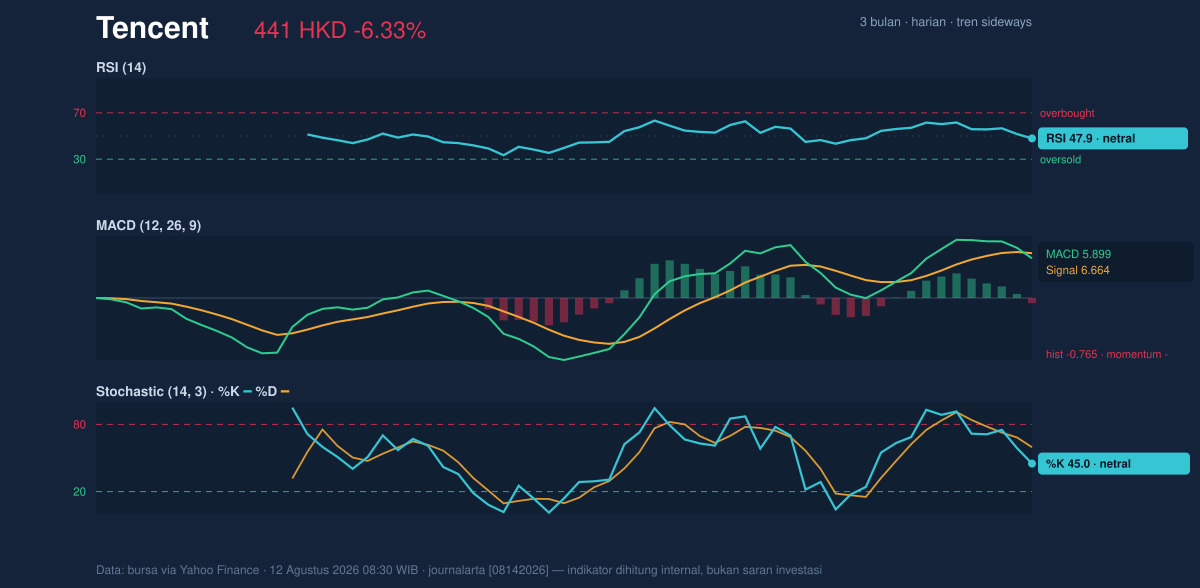
So the momentum picture is not broken, but it is clearly leaning against the bulls.
Volatility & Volume
Volatility is present, but not extreme. Tencent’s ATR(14) is 13.57, or 3.1% of price, which points to moderate daily movement. That is important because a stock can fall sharply even without a volatility spike if the market is repricing it gradually over several sessions. The Bollinger Band width of 14.7% is described as normal, so this is not a classic squeeze setup where a major expansion is about to erupt from a tight coil. Instead, the bands suggest price has room to move, but not from a tightly compressed base that would usually precede a dramatic breakout.
The %B reading of 10% is more revealing. It means price is trading very close to the lower end of the Bollinger envelope, which often reflects short-term oversold pressure. But oversold is not the same as reversal. It simply means the stock is near the edge of its recent volatility range. Volume adds a useful nuance: the latest turnover of 27,593,015 is roughly 1.0x normal versus the 20-session average of 28,257,543, while OBV is rising. That combination suggests participation has not collapsed, and the cumulative volume flow is still constructive even as the price weakens. In plain language, there are still buyers in the system, but they have not yet overwhelmed the selling.
This is a market under pressure, not a market without interest.
Key Levels & Scenarios
The nearest technical floor is support at 434.60. That level now matters more than usual because it sits just below the current price and near the lower Bollinger Band at 433.87. When support and band support cluster together, they often form a decision point: either the market stabilizes there, or it slices through and accelerates lower as stops are triggered.
On the upside, resistance sits at 492.20, which is also close to the 3-month high of 497.80. That makes the upper end of the recent range a meaningful ceiling. A move back toward that zone would need more than a reflex bounce; it would need momentum to improve and price to reclaim the moving averages first. The 3-month low at 411.00 shows how much room exists below if support fails. In short, the chart is boxed in between a nearby floor and a much higher ceiling, with price currently leaning on the floor.
If 434.60 holds, the market can attempt a mean-reversion bounce toward the mid-band and then the moving averages. If it fails, the next test becomes whether the stock can defend the broader low area around 411.00.
Technical Verdict: HOLD (wait & see)
HOLD (wait & see)
- Price is below SMA20 and SMA50, which shows trend weakness, but the broader structure is still sideways rather than decisively broken.
- MACD is negative while RSI and Stochastic are neutral, so momentum is weak but not yet washed out enough to confirm a durable reversal.
- %B at 10% and price near support at 434.60 mean the stock is close to a technical decision zone, where either stabilization or further downside can emerge.
Verdict invalidated if price falls below 434.60, because that would weaken the current support base and expose the 411.00 area.
- Ideal Entry Range: 434.60 to 441.00 HKD
- Exit Target: 456.66 to 468.17 HKD
- Stop Loss protection: below 434.60 HKD
For non-traders: Tencent is near a technical floor, but the chart still needs to prove that the selling has actually stopped.
“The next few sessions will show whether this is just a dip, or the market telling us something more serious.”
Summary Data Tencent
| Last price | 441.00 HKD |
| Change 1 day / 5 days / 1 month | -6.33% / -10.40% / -6.96% |
| Trend / MA-cross | sideways / none |
| SMA20 / SMA50 | 468.17 / 456.66 |
| RSI (14) / Stochastic %K | 47.9 / 45.0 |
| Bollinger %B / ATR | 10% / 13.57 |
| Support / Resistance 20 days | 434.60 / 492.20 |
| Data as of | 12 Agustus 2026 08:30 WIB |


