AstraZeneca Stock Analysis: Gains 1.23%, Testing Key Resistance
On September 28, 2026: price 12,552.00 GBp, trend sideways, RSI 57.7, support 11,650.00, resistance 12,672.00. technical analysis of astrazeneca stock.

AstraZeneca’s shares on the LSE rose to 12,552.00 GBp by 25 September 2026 at 14:00 WIB, up 1.23% on the day and extending a 3.62% gain over the past month, according to Yahoo Finance data from the exchange. The move leaves the stock above both its short- and medium-term trend measures, but not in a clean breakout: the chart shows a market that is still sideways, with buyers pressing the upper half of the range while momentum indicators hint that the advance may be getting stretched.
Trend & Price Action
The most important signal is that AstraZeneca is trading above the SMA20 at 12,152.10 and also above the SMA50 at 12,185.72. That matters because prices above both moving averages usually mean the market is holding a constructive posture, even if the broader trend is not yet decisively upward. Here, however, the absence of a new MA cross suggests the shares are not in a fresh trend phase; they are still working through a range.
The slope of the SMA20 is only 0.60% over 5 days, which reinforces the sideways label. In plain language, the average is edging higher, but not enough to signal a forceful directional move. The stock is also sitting near the top of its recent trading band, with price at 88% of the 20-hour range and just below resistance at 12,672.00. That positioning tells traders that the market has room to test the ceiling, but it has not yet proven it can clear it.
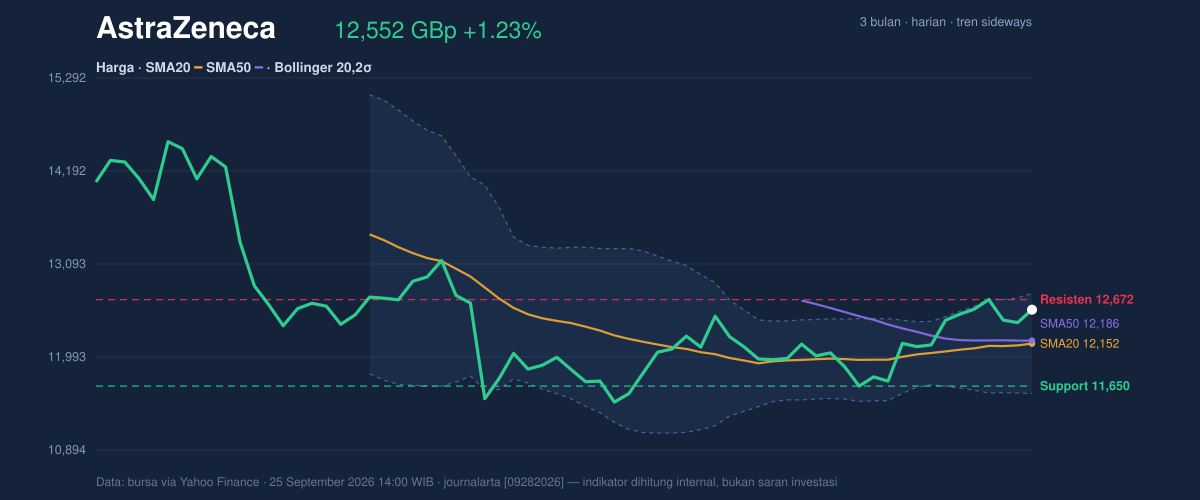
The broader context is still useful. The 3-month range runs from 9,892.00 to 14,686.00, so the current level is well above the lower end but still some distance from the peak. That is typical of a stock that has recovered meaningfully without fully escaping consolidation.
Oscillators & Momentum
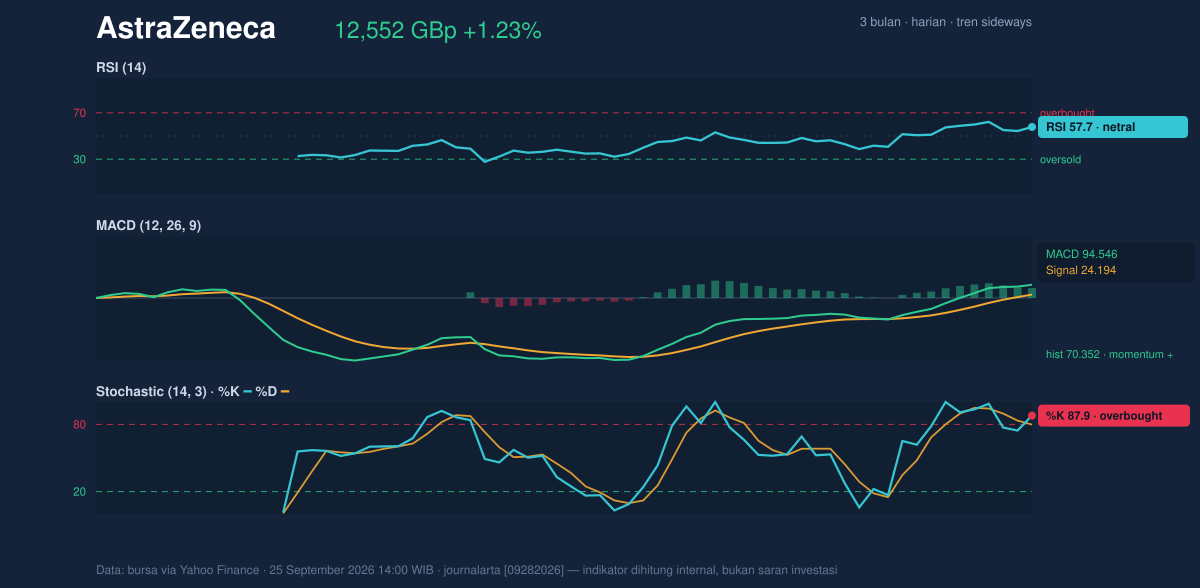
Momentum is more mixed than the price trend. The RSI at 57.7 is neutral, which means the stock is not overextended on a broad momentum basis. But the Stochastic %K at 87.9 and %D at 79.8 are both in overbought territory, a sign that the recent push higher has become crowded in the short term. In practical terms, that does not automatically mean a reversal is imminent; it does mean the stock may need to pause or consolidate before it can extend further.
The MACD at 94.546, versus a signal line of 24.194, remains firmly positive, with a histogram of 70.352. That is a strong confirmation that upward momentum is still present beneath the surface. When MACD is this far above its signal line, it often indicates that the trend has enough force to stay intact, even if the shorter-term oscillators look tired. The tension between a neutral RSI and overbought Stochastic readings usually means the market is advancing, but at a pace that may invite volatility around nearby resistance.
Volatility & Volume
Bollinger Bands help frame how stretched the move is. The upper band sits at 12,743.49, the middle band at 12,152.10, and the lower band at 11,560.71. With %B at 84%, the price is trading in the upper part of the band structure, close to the top. That signals strength, but also a reduced margin for error; the stock is not cheap relative to its recent distribution. The band width is 9.7%, described as normal, so this is not a volatility squeeze setting up for an explosive move. Instead, it suggests a regular trading environment where follow-through still depends on participation.
Volume is where the picture becomes more cautious. The latest turnover of 1,735,781 is only 0.5× the 20-hour average of 3,191,645. In other words, the advance is happening on quieter trading than usual. That matters because price gains backed by thin volume can be easier to fade. Still, OBV is rising, which means cumulative volume flow is still trending in the right direction. The message is subtle but important: there is evidence of underlying accumulation, yet the latest session does not show strong participation.
ATR at 275.16, or 2.2% of price, points to moderate volatility. That is enough to allow a meaningful move through resistance, but also enough to produce a sharp pullback if buyers hesitate.
Key Levels & Scenarios
The immediate technical map is clear. Support at 11,650.00 is the first level to watch if the stock loses momentum. Below that, the Bollinger middle band at 12,152.10 and the SMA20 at the same level become important reference points for trend integrity. On the upside, resistance at 12,672.00 lines up closely with the upper Bollinger band at 12,743.49, creating a tight zone where the stock may stall or break out.
If AstraZeneca can push through 12,672.00 with stronger volume, the chart would suggest the market is attempting to convert range resistance into support. If it fails there, the overbought Stochastic readings raise the odds of a retreat back toward the mid-band area. The stock’s location near the upper end of the range means the next move matters more than usual: either it confirms that the recent climb is gaining acceptance, or it slips back into the middle of the band structure.
Technical Verdict: HOLD (wait & see)
HOLD (wait & see)
- MACD remains strongly positive, showing the broader momentum trend is still supportive.
- Price is above SMA20 and SMA50, which keeps the chart constructive.
- Stochastic is overbought and volume is 0.5× average, so the latest push lacks strong participation.
Verdict invalidated if price falls below 11,650.00.
- Ideal Entry Range: 11,650.00 to 12,152.10
- Exit Target: 12,672.00 to 12,743.49
- Stop Loss Protection: below 11,560.71
In plain English: the stock still looks supported, but it is close enough to resistance that confirmation matters more than enthusiasm.
AstraZeneca’s shares closed the session with OBV rising and volume at 1,735,781, below the 3,191,645 20-hour average.
Summary Data AstraZeneca
| Last price | 12,552.00 GBp |
| Change 1 day / 5 days / 1 month | 1.23% / 0.42% / 3.62% |
| Trend / MA-cross | sideways / none |
| SMA20 / SMA50 | 12,152.10 / 12,185.72 |
| RSI (14) / Stochastic %K | 57.7 / 87.9 |
| Bollinger %B / ATR | 84% / 275.16 |
| Support / Resistance 20 days | 11,650.00 / 12,672.00 |
| Data as of | 25 September 2026 14:00 WIB |


