Tencent Stock Technicals Today: Drops 0.41%, Momentum Gains
On September 28, 2026: price 436.60 HKD, trend sideways, RSI 48.6, support 419.00, resistance 453.00. technical analysis of tencent stock.

Tencent Holdings slipped to HK$436.60 on HKEX in Hong Kong, down 0.41% from the previous close, as the stock hovered just above its short-term average while the broader pattern stayed stuck in a sideways range. The move matters less for the size of the daily loss than for what it says about positioning: Tencent is still holding the SMA20 at HK$435.78, but it remains below the SMA50 at HK$449.78, a setup that signals the shares are stabilising without yet proving a clean trend reversal. As shown in the chart, the price is sitting around the middle of its recent band, not at an extreme, which usually means the market is waiting for a catalyst rather than committing strongly in either direction.
Trend & Price Action
The structure is best described as a consolidation phase with a mild upward bias in the very short term. Tencent’s price is above the SMA20, which tells traders the latest pullback has not broken near-term support, but the price remains below the SMA50, showing medium-term momentum has not fully recovered. That gap between the two averages is important: it suggests the stock is still digesting the earlier decline rather than resuming a decisive advance. The chart also shows no fresh MA cross, so there is no new moving-average signal to confirm a trend change.
The broader range reinforces that reading. Tencent is trading well above the 3-month low of HK$411.00, but still below the 3-month high of HK$497.80, which places it in the middle of the year-to-date battleground. In practical terms, the market has not rejected the stock, but it has also not rewarded it with a breakout.
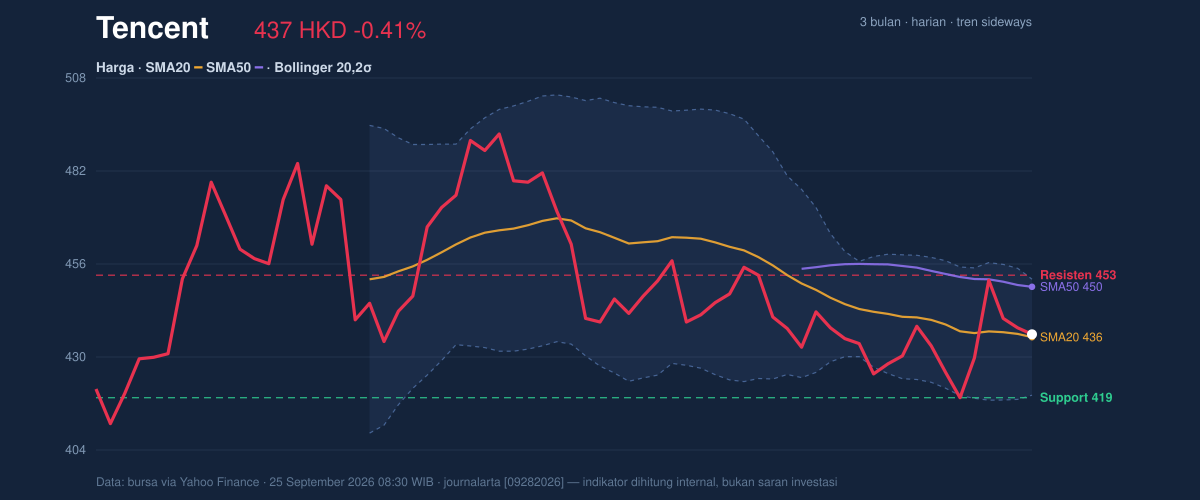
The key message from price action is simple: support is holding, but conviction is thin.
Oscillators & Momentum
Momentum indicators are mixed, and that is exactly what a sideways market should look like. The RSI at 48.6 is neutral, meaning Tencent is neither overbought nor oversold. That matters because it leaves room for movement in either direction without an immediate exhaustion signal. The Stochastic %K at 39.6 and %D at 44.3 also sit in neutral territory, but with %K below %D, short-term momentum is still slightly softer than the broader average. In plain language, the stock is not yet showing the kind of momentum pop that usually accompanies a strong breakout.
The more constructive clue comes from the MACD. Tencent’s MACD at -3.066 remains below zero, which means the medium-term trend has not fully flipped positive, but the histogram at 1.577 is positive and the MACD line is above the signal line at -4.643. That combination often signals improving momentum beneath the surface, even if the price has not yet caught up. It is a subtle but important distinction: the stock is not in a powerful uptrend, but selling pressure appears to be easing.
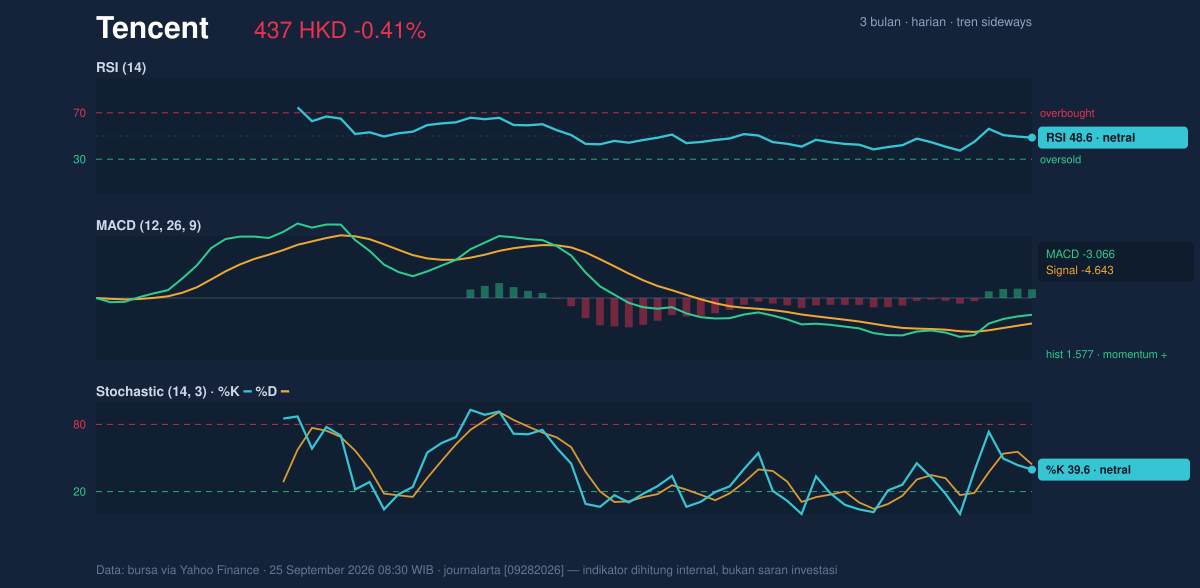
The oscillators are not shouting “breakout,” but they are no longer flashing outright weakness.
Volatility & Volume
Bollinger Bands suggest Tencent is coiling rather than trending hard. The upper band at HK$451.88 and lower band at HK$419.68 define a fairly contained range, and the band width of 7.4% is described as a squeeze. A squeeze usually means volatility has compressed, which can precede a sharper move once the market chooses a direction. The stock’s %B at 53% puts it slightly above the midpoint of the band, another sign that price is balanced rather than stretched.
Volatility is present, but not excessive. Tencent’s ATR(14) at 11.87, or 2.7% of price, indicates moderate daily movement. That is enough to create range-trading opportunities, but not enough to imply disorderly swings.
Volume, however, is the caution flag. The latest turnover of 9,113,746 is only 0.4x the 20-day average of 20,328,677, so the move is happening on quiet participation. That usually weakens the reliability of any price push, because breakouts and breakdowns are more convincing when accompanied by heavier trading. The one encouraging detail is that OBV is rising, which implies the balance of volume has still been accumulating over time even if the latest session was quiet.
Quiet trading, rising accumulation.
Key Levels & Scenarios
The immediate map is clear. Support at HK$419.00 is the first level to watch, while resistance at HK$453.00 is the key ceiling. Tencent is currently sitting at about 52% of the 20-day range, which means it is neither pressed against support nor challenging resistance. That middle position is exactly where traders often wait for confirmation.
If the stock pushes through HK$453.00, the chart would start to argue that the squeeze is resolving upward, with the next test likely coming from the upper Bollinger band at HK$451.88 already close by. If it fails to hold HK$419.00, the market would be signalling that the recent stabilisation has broken down, and the 3-month low at HK$411.00 becomes the next reference point. The key point is that Tencent is close enough to both sides of the range that the next decisive move could matter more than the current drift.
Technical Verdict: HOLD (wait & see)
HOLD (wait & see)
- SMA20 support is intact at HK$435.78, which keeps the short-term structure from turning weak.
- MACD momentum is improving with a positive histogram at 1.577, but the line is still below zero, so trend confirmation is incomplete.
- Bollinger Bands are squeezing with 7.4% width, suggesting a larger move may be coming, but direction is not yet confirmed.
- Verdict invalidated if price falls below HK$419.00, because that would break the nearest support and weaken the consolidation base.
- Ideal entry range: near HK$435.78 to HK$419.00 on confirmed support, or on a clear move above HK$453.00 with stronger participation.
- Exit target: HK$451.88 to HK$453.00 on a range rebound; beyond that, the chart would need a fresh breakout confirmation.
- Stop loss protection: below HK$419.00, with the deeper reference at HK$411.00 if support fails.
For non-traders, this means Tencent is not weak enough to look broken, but not strong enough yet to prove a new advance.
“The stock is waiting for a trigger, and the next move will tell the story.”
Summary Data Tencent
| Last price | 436.60 HKD |
| Change 1 day / 5 days / 1 month | -0.41% / 4.20% / -4.09% |
| Trend / MA-cross | sideways / none |
| SMA20 / SMA50 | 435.78 / 449.78 |
| RSI (14) / Stochastic %K | 48.6 / 39.6 |
| Bollinger %B / ATR | 53% / 11.87 |
| Support / Resistance 20 days | 419.00 / 453.00 |
| Data as of | 25 September 2026 08:30 WIB |


