HSBC Stock Analysis: Gains 0.83%, Testing Support Level
On September 28, 2026: price 1,512.20 GBp, trend sideways, RSI 46.8, support 1,499.80, resistance 1,580.20. technical analysis of hsbc stock.

HSBC Holdings edged up to 1,512.20 GBp on the LSE, a modest 0.83% daily rise that leaves the shares still trading below SMA20 at 1,535.18 and below SMA50 at 1,532.76, according to exchange-fed data as of 25 September 2026 14:00 WIB. That placement matters: the stock is not in a clear uptrend, but neither is it breaking down decisively. It is sitting in the middle of a narrow technical corridor, with the market waiting for a catalyst to choose direction.
Trend & Price Action
The broader setup remains sideways, and the key clue is the slightly negative SMA20 slope of -0.07% over 5 days. A falling short-term average, even a gentle one, usually signals that recent buying has not been strong enough to reassert trend control. HSBC’s price is also below the 20-day and 50-day averages, which tells traders the recent rebound has not yet repaired the damage from earlier weakness. There is no fresh MA-cross, so the chart lacks the kind of moving-average signal that often marks a trend shift. In plain terms, the stock is drifting rather than leading.
The range tells a similar story. The shares are trading at 1,512.20 GBp, just above the 20-hour support at 1,499.80 and well below the 20-hour resistance at 1,580.20. That puts the price in the lower part of the current band, but not at an extreme. Against the 3-month range of 1,350.00 to 1,610.00, HSBC is closer to the middle than to either edge, which usually means the market is still pricing in uncertainty rather than conviction.
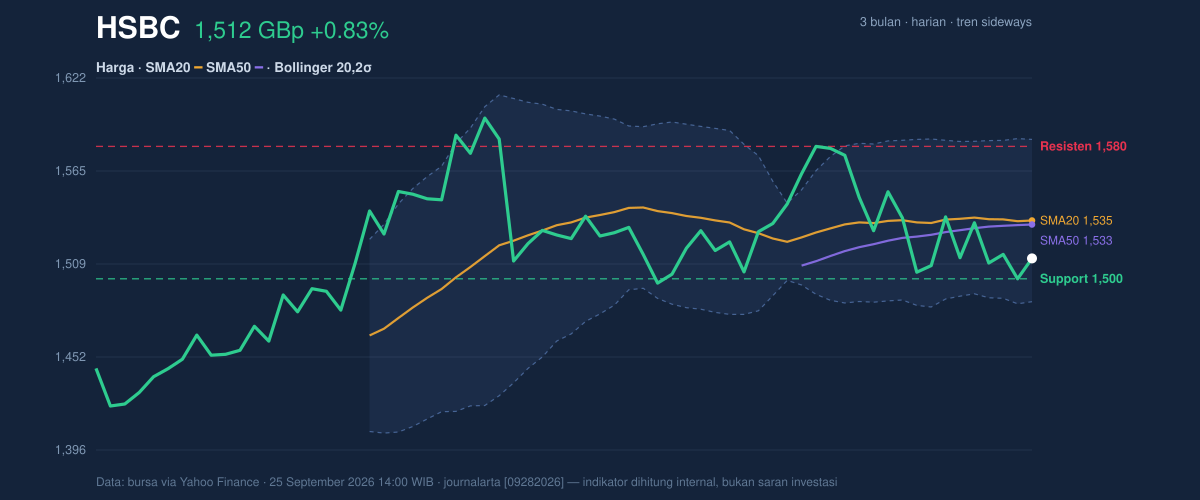
The chart also shows a tighter structure developing around price. That matters because compressed ranges often precede a sharper move once one side gives way.
Oscillators & Momentum
Momentum is mixed, and that mix leans cautious. The RSI at 46.8 is neutral, which means the stock is neither stretched nor oversold. Neutral RSI often reflects indecision: buyers have not been strong enough to push the reading into bullish territory, but sellers have not forced it into a capitulation zone either. The Stochastic %K at 20.1 and %D at 13.6 also sit in neutral territory, though close to the lower end of the scale, suggesting the stock has room to recover if demand improves. What they do not show is an established momentum breakout.
The more important signal is the MACD at -5.223, with the signal line at -0.899 and the histogram at -4.325. MACD measures the gap between short- and medium-term trend pressure; a negative reading with a wide negative histogram means downside momentum is still dominating, even if the price is not falling aggressively day to day. In other words, the stock is not deeply oversold, but the underlying impulse remains weak.
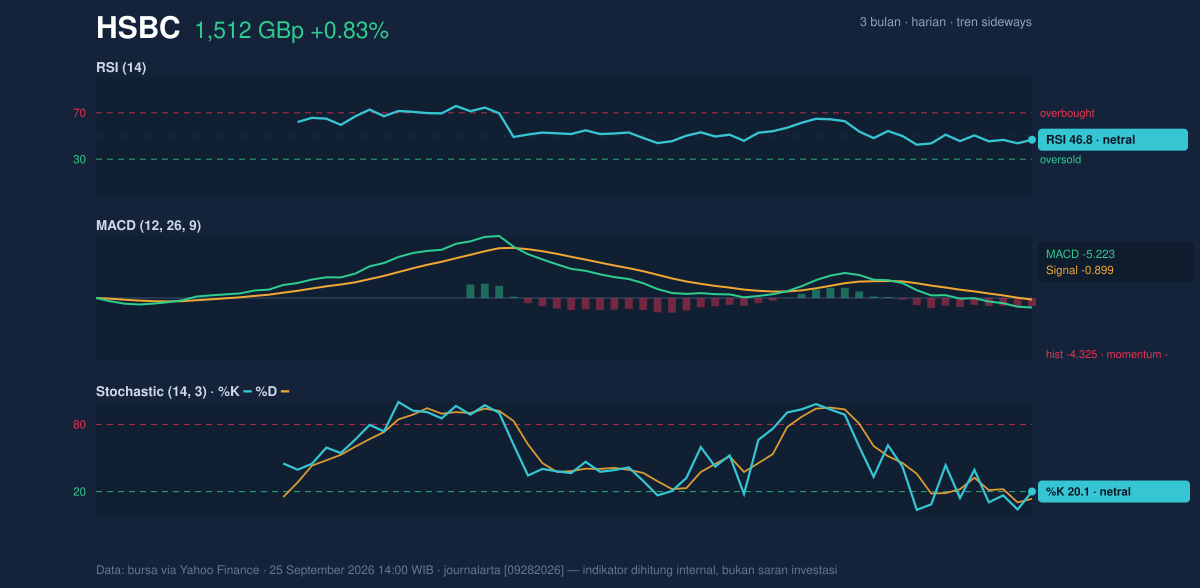
That combination — neutral oscillators, negative MACD — often appears when a stock is consolidating under pressure rather than building a clean base.
Volatility & Volume
Volatility is not absent, but it is contained. The Bollinger Bands are relatively tight, with the upper band at 1,584.44, the middle band at 1,535.18, and the lower band at 1,485.92. The band width of 6.4% is described as a squeeze, which signals reduced trading range and a higher chance of a directional break if volume arrives. The stock’s %B at 27% shows price is sitting in the lower part of the Bollinger envelope, closer to the lower band than the middle. That is not a sell signal by itself, but it does mean the market is leaning weak within a compressed range.
The ATR(14) at 30.85, or 2.0% of price, points to moderate day-to-day movement. That is important because it suggests any breakout may not be explosive immediately, but it could still be meaningful if participation improves.
Participation, however, is currently missing. Volume at 10,200,809 is only 0.5x the 20-session average of 19,906,054, and OBV is falling. OBV, or on-balance volume, tracks whether volume is supporting price direction; a decline in OBV says money flow is not confirming the recent bounce. That is a warning sign for anyone looking for a durable recovery: price can rise on quiet trading, but quiet trading rarely builds a strong trend.
Key Levels & Scenarios
The immediate line in the sand is 1,499.80. A clean move below that support would expose the lower Bollinger band at 1,485.92, which is the nearest technical cushion in the current setup. On the upside, the first barrier is 1,535.18, where the price meets the middle Bollinger band and SMA20. Above that, the next hurdle is 1,580.20, then the upper Bollinger band at 1,584.44. A move through that zone would matter because it would show the stock has escaped the lower half of its volatility envelope and is no longer being capped by short-term trend resistance.
The key point is that HSBC is boxed in: support is close enough to matter, but resistance is still overhead, and volume is not yet strong enough to force a decisive test.
Technical Verdict: HOLD (wait & see)
HOLD (wait & see)
- MACD remains negative, showing the underlying momentum is still weak even though the price has stabilized.
- Price is below SMA20 and SMA50, so the stock has not reclaimed short-term trend control.
- Bollinger Bands are in a squeeze, which raises the odds of a move, but not the direction.
Verdict invalidated if price falls below 1,499.80, because that would break the nearest support and shift attention toward 1,485.92.
- Ideal Entry Range: 1,499.80 to 1,535.18
- Exit Target: 1,580.20 to 1,584.44
- Stop Loss protection: below 1,485.92
In plain English, the chart says HSBC is stuck in a narrow range and needs stronger trading activity before it can prove a lasting direction.
The latest support level remains 1,499.80.
Summary Data HSBC
| Last price | 1,512.20 GBp |
| Change 1 day / 5 days / 1 month | 0.83% / -0.03% / 0.55% |
| Trend / MA-cross | sideways / none |
| SMA20 / SMA50 | 1,535.18 / 1,532.76 |
| RSI (14) / Stochastic %K | 46.8 / 20.1 |
| Bollinger %B / ATR | 27% / 30.85 |
| Support / Resistance 20 days | 1,499.80 / 1,580.20 |
| Data as of | 25 September 2026 14:00 WIB |


