HSBC Stock Gains 1.11%, Testing Support Level In Focus
On September 29, 2026: price 1,516.40 GBp, trend sideways, RSI 46.9, support 1,499.80, resistance 1,580.20. technical analysis of hsbc stock.

HSBC Holdings’ London-listed shares rose to 1,516.40 GBp after a 1.11% daily gain, but the move still leaves the stock below both short-term averages and inside a narrow trading band. As shown in the chart, the message is not one of breakout strength yet: price is trying to recover, but the technical backdrop still points to a market that is consolidating rather than trending decisively.
Trend & Price Action
The broader pattern remains sideways, and that matters because sideways markets often reflect a tug-of-war between buyers and sellers rather than a clear directional vote. HSBC is trading below SMA20 at 1,535.18 and below SMA50 at 1,532.76, which tells investors that the latest bounce has not yet reclaimed the short- and medium-term trend lines. In simple terms, price is still under the levels that many chart watchers use as a sign of regained control.
The lack of a fresh MA-cross also keeps the setup neutral-to-cautious. A moving-average cross is often used as a signal that momentum has shifted from one side to the other; here, no new cross means the chart has not produced that kind of confirmation. The slight SMA20 slope of -0.07% over 5 days reinforces that the trend is drifting, not accelerating.
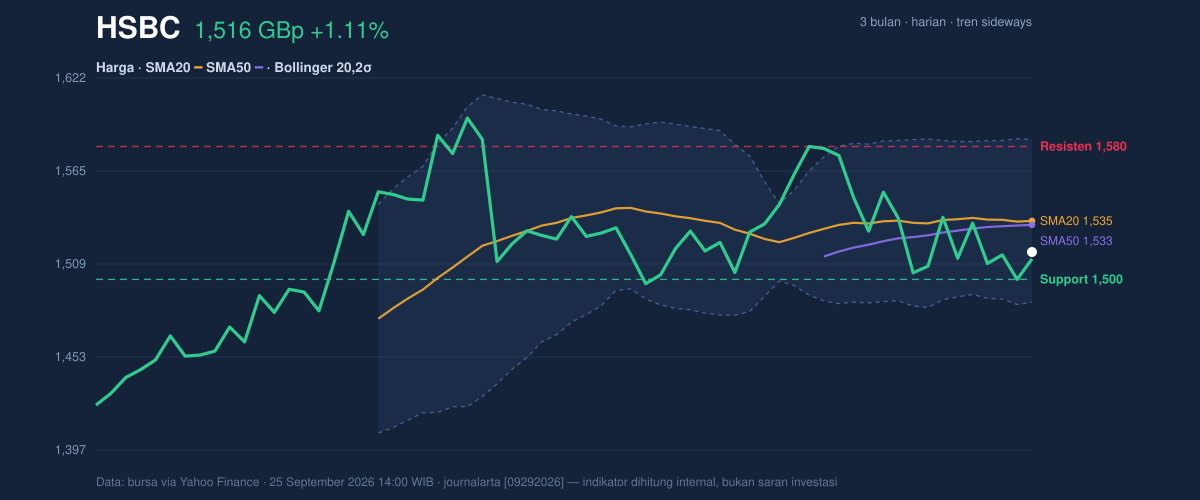
Price is also sitting near the lower half of its recent range. With the stock at 21% of the 20-hour range, it is closer to support than resistance, which can be constructive if buyers defend the floor — but it also means the market has not yet done the harder work of pushing back toward the top of the band. The 3-month high of 1,610.00 and 3-month low of 1,350.00 frame the bigger picture: HSBC has recovered from the lower end of that range, but it is still well short of the upper boundary that would signal a stronger re-rating.
A short line matters here: the chart is improving, but not healed.
Oscillators & Momentum
The momentum picture is mixed, which is often the most honest reading when a stock is stuck between trend lines. The RSI at 46.9 is neutral, meaning there is no sign of an overbought surge and no deep oversold condition either. For non-specialists, RSI is a gauge of how stretched recent buying or selling has become; at this level, it says the stock is neither overheated nor washed out.
The stochastic oscillator is also neutral, with %K at 20.1 and %D at 13.6. This is important because stochastic can highlight whether price is closing near the top or bottom of its recent range. Read together, these figures suggest HSBC has been moving near the lower end of its short-term band, but not in a way that yet confirms a strong reversal.
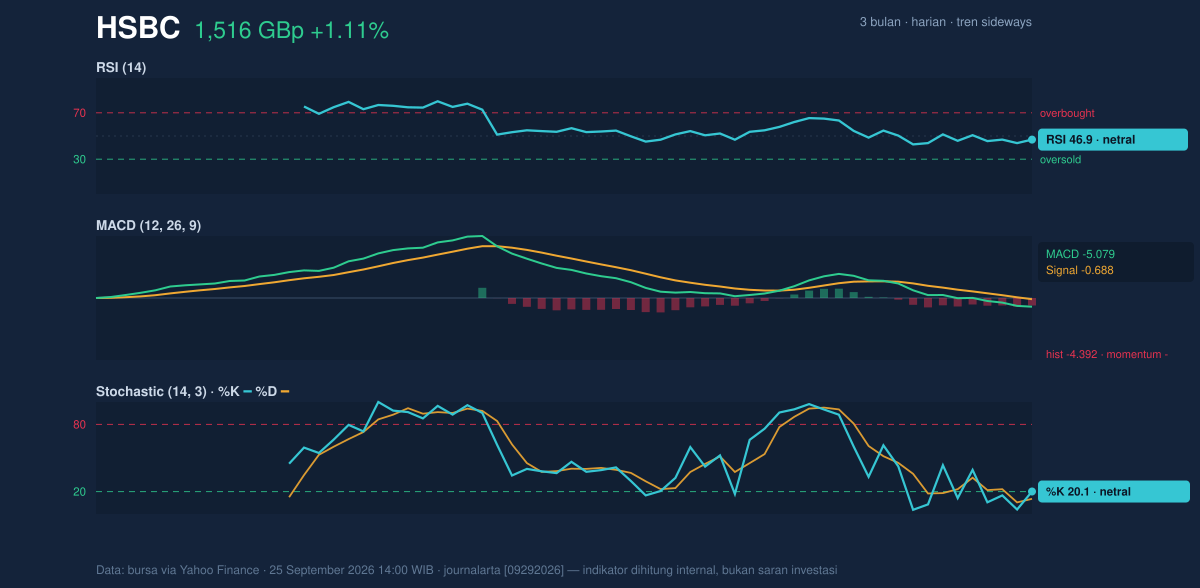
The clearest signal comes from MACD, where MACD is -5.079, below the signal line at -0.688, with a histogram of -4.392. That combination points to negative momentum still outweighing any recovery attempt. In plain English, the stock may be bouncing, but the underlying pace of change still favors sellers more than buyers. The histogram being negative and wide is especially telling: it shows the gap between the trend line and the trigger line remains unfriendly to a clean upside turn.
Volatility & Volume
Volatility is present, but not extreme. The ATR(14) at 30.85 equals about 2.0% of price, which indicates moderate daily movement potential. ATR, or average true range, is a measure of how much the stock tends to move in a session; at this level, HSBC is active enough to test levels, but not so wild that every candle signals a regime change.
The Bollinger setup is more interesting. The bands are relatively tight, with a 6.4% width, and the stock sits at %B 31%, meaning it is positioned in the lower third of the band structure. Tight bands often indicate a squeeze — a period when volatility compresses before a larger move. That does not tell us direction on its own, but it does say the market is storing energy. If price can reclaim the middle band at 1,535.18, the squeeze could resolve upward; if it loses nearby support, the same compression could release downward pressure.
Volume, however, does not yet validate the rebound. Last volume was 10,200,809, roughly 0.5× the 20-day average of 19,906,054, and OBV is falling. OBV, or on-balance volume, tracks whether trading activity is accumulating behind price gains or losses. A declining OBV alongside lighter-than-average turnover suggests the latest rise has not been backed by broad participation. That usually makes rallies less durable.
One sentence says it plainly: the bounce lacks crowd support.
Key Levels & Scenarios
The nearest floor is support at 1,499.80, which is also the previous close. That makes it a psychologically important line as well as a technical one. Above current levels, resistance at 1,580.20 marks the first barrier that would need to be cleared for the stock to shift from a range-bound recovery into something more persuasive. The Bollinger upper band at 1,584.44 sits just above that resistance, so the two levels cluster tightly and should be watched together.
If HSBC holds above 1,499.80, it keeps the current squeeze intact and leaves room for a test of 1,535.18, then 1,580.20. If it fails to hold that floor, the chart loses its nearest defense and the lower Bollinger band at 1,485.92 becomes the next technical reference. In a market with falling OBV and negative MACD, that downside trigger matters more than usual.
Technical Verdict: HOLD (wait & see)
HOLD (wait & see)
- MACD remains negative, with the histogram still below zero, so momentum has not confirmed a durable turn.
- Price is below SMA20 and SMA50, which means the stock has not yet reclaimed the short- and medium-term trend structure.
- Bollinger bands are tightening, suggesting a breakout may be building, but direction is not yet confirmed by volume or OBV.
Verdict invalidated if price breaks below 1,499.80, because that would weaken the nearest support and expose the lower Bollinger band at 1,485.92.
- Ideal Entry Range: 1,499.80 to 1,535.18
- Exit Target (Target Price): 1,580.20 to 1,584.44
- Stop Loss Protection: below 1,485.92
In plain English: HSBC is trying to stabilize, but it has not yet proved that the recovery has enough strength behind it.
The latest support level remains 1,499.80.
Summary Data HSBC
| Last price | 1,516.40 GBp |
| Change 1 day / 5 days / 1 month | 1.11% / 0.25% / 0.82% |
| Trend / MA-cross | sideways / none |
| SMA20 / SMA50 | 1,535.18 / 1,532.76 |
| RSI (14) / Stochastic %K | 46.9 / 20.1 |
| Bollinger %B / ATR | 31% / 30.85 |
| Support / Resistance 20 days | 1,499.80 / 1,580.20 |
| Data as of | 25 September 2026 14:00 WIB |



