AstraZeneca Stock Gains 0.74%, Testing Key Resistance In Focus
On September 29, 2026: price 12,492.00 GBp, trend sideways, RSI 57.4, support 11,650.00, resistance 12,672.00. technical analysis of astrazeneca stock.

AstraZeneca’s shares on the London Stock Exchange rose to 12,492.00 GBp by 25 September 2026 14:00 WIB, up 0.74% on the day and back above both short-term averages, according to Yahoo Finance data from the exchange. The move keeps the stock in a sideways pattern rather than a clean uptrend, but the price is now sitting near the upper end of its recent range, which matters because it shows buyers are still willing to pay up even after a muted five-day performance.
Trend & Price Action
The chart shows AstraZeneca trading above the SMA20 at 12,152.10 and also above the SMA50 at 12,185.72, a constructive setup that usually signals the market is holding gains rather than giving them back. There is no new MA-cross, so this is not a fresh trend breakout; instead, it looks like a stabilising phase in which the stock is drifting higher while digesting earlier gains. The 0.60% five-day slope in the SMA20 points to mild upward pressure, but not enough to call the move decisive.
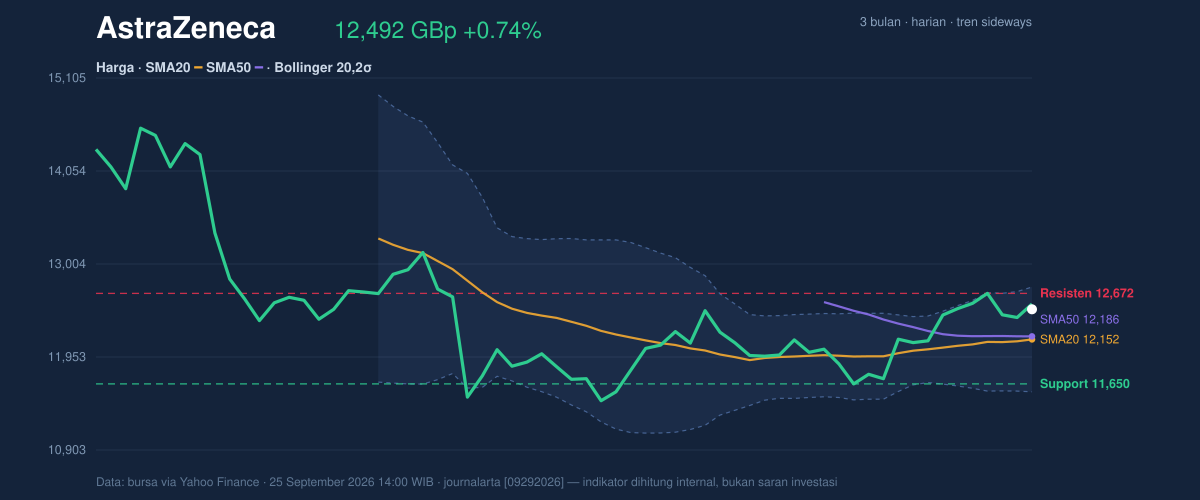
The position inside the recent band is more revealing than the daily change alone. At 12,492.00 GBp, the shares are already at 82% of the 20-day range, with 12,672.00 marked as the nearest resistance and 11,650.00 as support. That placement suggests the market has room to test the top of the range, but it is also close enough to resistance that momentum may need stronger participation to extend.
The broader three-month range, from 9,892.00 to 14,686.00, shows the current price is still well below the recent peak. That means the stock is recovering, not breaking into uncharted territory, and the technical story is about whether it can keep building a base above the moving averages.
Oscillators & Momentum
Momentum is mixed, and that mix is important. The RSI at 57.4 is neutral, which means the stock is neither stretched nor weak on a broad momentum reading. In plain language, RSI is not warning of exhaustion, but it is also not confirming a powerful breakout.
The stochastic oscillator tells a sharper story. With %K at 87.9 and %D at 79.8, the indicator is in overbought territory, which often means short-term enthusiasm has run ahead of the broader trend. That does not automatically mean a reversal, but it does imply the shares may need either a pause or a fresh burst of buying to keep climbing without losing steam.
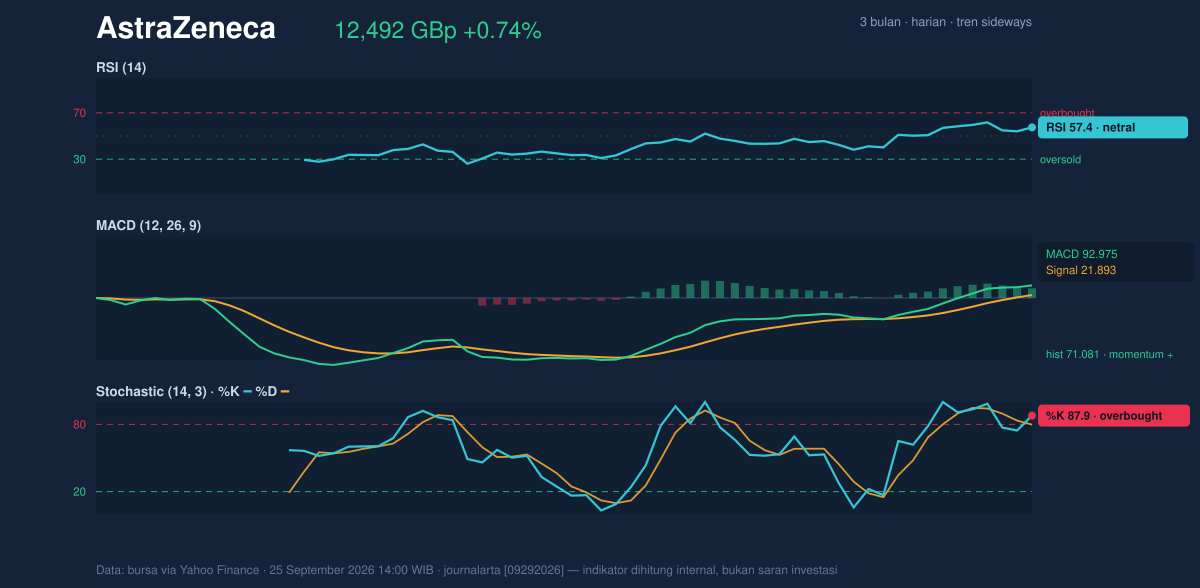
The MACD setup is more supportive. With MACD at 92.975, the signal line at 21.893 and a histogram of 71.081, the trend impulse remains positive. The histogram is the key clue here: it shows the gap between the MACD line and its signal line, so a wide positive reading usually indicates momentum is still in the bulls’ favour. In other words, the stock is not showing a bearish reversal signal yet, even if the stochastic is warning that the near-term move is getting crowded.
Volatility & Volume
Volatility is present, but not alarming. The ATR at 275.16, equal to 2.2% of price, points to moderate daily movement, which is enough to create meaningful swings without suggesting disorderly trading. Bollinger Bands reinforce that view. The band width is 9.7%, described as normal, so this is not a squeeze waiting for a violent release, nor an expansion that would imply a breakout is already underway.
The price sits at %B 79%, which means it is trading closer to the upper Bollinger Band at 12,743.49 than the middle band at 12,152.10. That positioning usually reflects firm short-term tone, but it can also limit immediate upside if buyers do not add volume. And volume is the weak spot in this session: 1,735,781 shares changed hands versus a 20-day average of 3,191,645, or about 0.5x normal activity. The OBV is rising, though, which suggests volume flow has been supportive over time even if this particular session was quiet.
That combination matters. Rising OBV with light current volume often means accumulation is happening gradually rather than through a forceful breakout. It is constructive, but not yet emphatic.
Key Levels & Scenarios
The immediate technical map is clear. 12,672.00 is the first level that needs to be cleared for the stock to show better follow-through. Above that, the upper Bollinger Band at 12,743.49 becomes the next visible ceiling. On the downside, 12,185.72 and 12,152.10 form the first support cluster, while 11,650.00 is the more important floor from the 20-day range.
If price holds above the moving averages and pushes through 12,672.00, the chart would shift from range-trading to a more constructive breakout attempt. If it fails to hold 12,152.10, the market would be signalling that the recent lift has lost traction and that the sideways pattern is reasserting itself.
Technical Verdict: HOLD (wait & see)
HOLD (wait & see) fits the current setup because the stock is constructive above the short-term averages, but short-term momentum is stretched and volume is not confirming a decisive breakout.
- Reason 1: price is above SMA20 and SMA50, which keeps the trend structure positive.
- Reason 2: MACD is strongly positive, so underlying momentum is still intact.
- Reason 3: Stochastic is overbought, which warns that near-term upside may be harder to sustain without stronger participation.
Verdict invalidated if price breaks below 11,650.00, because that would take the shares out of the current 20-day support zone and weaken the range structure.
- Ideal Entry Range: 12,152.10 to 12,185.72
- Exit Target: 12,672.00 to 12,743.49
- Stop Loss protection: 11,650.00
In plain English, the chart says AstraZeneca is holding up, but it has not yet proved that the latest rise can turn into a stronger move.
Summary Data AstraZeneca
| Last price | 12,492.00 GBp |
| Change 1 day / 5 days / 1 month | 0.74% / -0.06% / 3.12% |
| Trend / MA-cross | sideways / none |
| SMA20 / SMA50 | 12,152.10 / 12,185.72 |
| RSI (14) / Stochastic %K | 57.4 / 87.9 |
| Bollinger %B / ATR | 79% / 275.16 |
| Support / Resistance 20 days | 11,650.00 / 12,672.00 |
| Data as of | 25 September 2026 14:00 WIB |



