AstraZeneca Stock Drops 0.15%, Momentum Gains In Focus
On September 17, 2026: price 12,136.00 GBp, trend sideways, RSI 51.4, support 11,650.00, resistance 12,476.00. technical analysis of astrazeneca stock.

AstraZeneca’s shares on the LSE were little changed in afternoon trade in London, with AZN.L last at 12,136.00 GBp, down 0.15% on the day, even as the stock has edged 2.19% higher over five days and 4.98% over one month. That combination matters: it suggests the market is not chasing the name aggressively, but neither is it abandoning it. Instead, the share price is trying to hold a constructive range after a modest recovery, with the chart now sitting close enough to short-term support to keep both sides of the tape engaged.
Trend & Price Action
The broader setup is best described as sideways, not trending, and that is reinforced by the SMA20 at 12,024.10 versus the SMA50 at 12,291.36. Price is above the SMA20 but still below the longer average, which usually signals a market that has stabilised in the short term without yet proving a fuller trend reversal. In plain English, traders have stopped selling the stock as if momentum were broken, but they have not yet pushed it convincingly back into a stronger uptrend.
That split is also visible in the moving-average posture. There is no new MA-cross, so the chart is missing the kind of clean signal that often accompanies a trend change. The SMA20 slope of 0.46% over five days points upward, which is a mild positive, but not strong enough on its own to imply a fresh breakout. As shown in the chart, the price is now trading inside the middle of its recent band, not at an extreme.
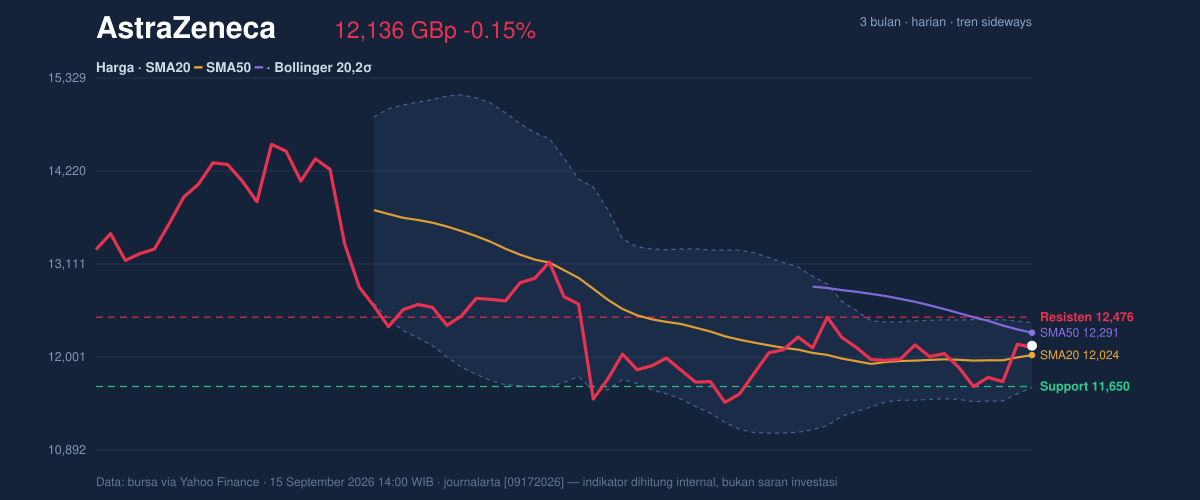
The stock is positioned 59% through its 20-hour range, with 11,650.00 acting as support and 12,476.00 as resistance. That placement is important because it leaves room on both sides: the share is not stretched against resistance, but it is also not comfortably anchored at support. The broader three-month range, from 9,892.00 to 15,126.00, shows how much air is still above and below the current price. AstraZeneca is trading in the middle of that corridor, which usually points to consolidation rather than a decisive directional phase.
Oscillators & Momentum
Momentum indicators are not flashing a warning, but they are not yet shouting conviction either. The RSI at 51.4 is neutral, which means the stock is neither overbought nor oversold. That matters because it leaves room for price to move either way without immediately running into an oscillator extreme. The Stochastic %K at 61.8 and %D at 48.0 also sits in neutral territory, but with %K above %D, the short-term impulse is slightly better than the medium-term reading. In practical terms, that suggests the latest bounce has some follow-through, though not enough to be called decisive.
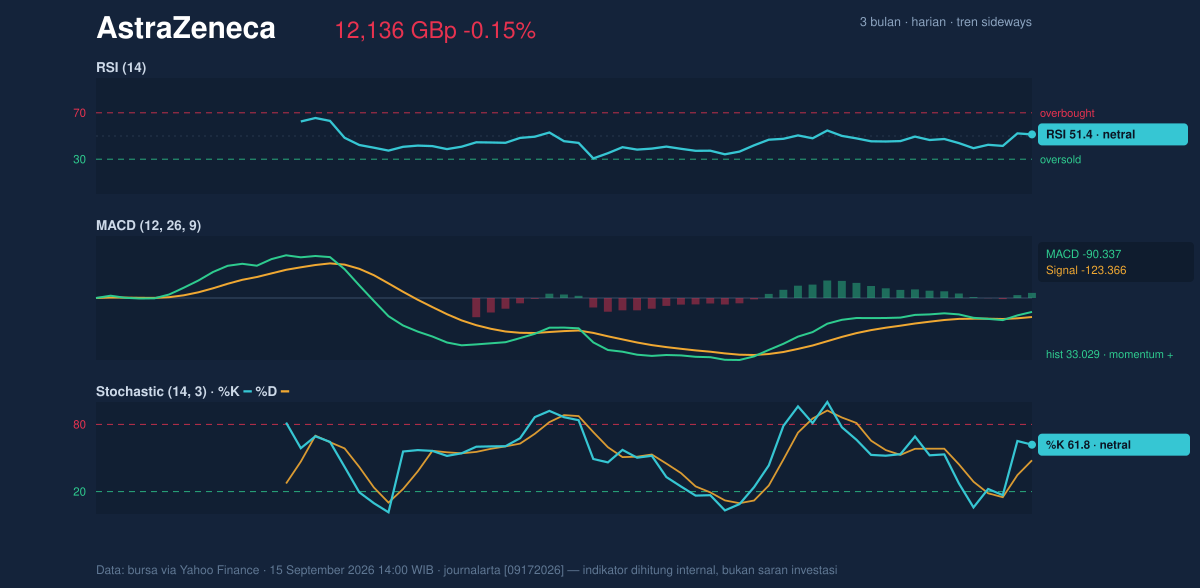
The most constructive signal is the MACD histogram at 33.029, with the MACD line at -90.337 above the signal line at -123.366. Even though both lines remain below zero, the gap is narrowing in a positive way, which usually means downside momentum has eased and the stock is trying to build a base. That is not the same as an outright bullish trend. It is, however, a sign that sellers have lost some force, and that often shows up before the price starts testing the upper end of a range.
Volatility & Volume
Volatility is present, but not excessive. The ATR(14) of 308.17, equal to 2.5% of price, points to a market that can still move meaningfully in a session, but is not in a panic regime. Meanwhile, the Bollinger Bands are tightening, with the upper band at 12,410.16, the middle band at 12,024.10 and the lower band at 11,638.04. The %B at 64% tells us price is sitting above the midline but below the upper band, which is a mild bullish position rather than an overextended one. More importantly, the 6.4% band width is narrowing, a classic squeeze pattern that often precedes a larger move. A squeeze does not tell direction; it tells you the market is compressing energy.
Volume adds a useful confirmation layer. Last trade volume of 3,056,945 was about 1.1× the 20-session average of 2,844,221, while OBV is rising. That combination suggests the latest improvement is not happening on empty participation. Rising on-balance volume matters because it implies that net buying pressure has been improving even while price action remains range-bound. As shown in the chart, the stock is not yet breaking out, but the accumulation footprint is better than the headline price drift alone would suggest.
Key Levels & Scenarios
The immediate technical map is straightforward. 11,650.00 is the first line to watch on the downside, because it aligns closely with the lower edge of the recent trading range and sits just above the Bollinger lower band at 11,638.04. A failure there would weaken the current base and expose the stock to a deeper retracement. On the upside, 12,410.16 is the first technical hurdle from the Bollinger structure, while 12,476.00 is the key resistance from the recent range. A move through that zone would suggest the squeeze is resolving in favour of higher prices.
The current positioning near the middle of the band means the market is waiting for confirmation. If price holds above 12,024.10 and then clears 12,410.16, the chart would begin to look more constructive. If it slips back below 11,650.00, the neutral-to-positive tone would fade quickly, because the stock would lose both range support and the lower Bollinger cushion.
Technical Verdict: HOLD (wait & see)
The setup is balanced, with a mild positive bias but no clean trend confirmation. MACD is improving, OBV is rising, and the Bollinger squeeze suggests a larger move may be building. At the same time, RSI and Stochastic remain neutral, and the price is still below the SMA50, so the chart has not yet earned a stronger directional verdict.
- Ideal entry range: 12,024.10 to 11,650.00
- Exit target: 12,410.16 to 12,476.00
- Stop loss protection: below 11,638.04 or, more conservatively, below 11,650.00
The verdict is invalidated if price falls below 11,650.00.
In plain English: the shares are holding steady, but the chart still needs a stronger push before the next move becomes clearer.
The latest 3-month high is 15,126.00.
Summary Data AstraZeneca
| Last price | 12,136.00 GBp |
| Change 1 day / 5 days / 1 month | -0.15% / 2.19% / 4.98% |
| Trend / MA-cross | sideways / none |
| SMA20 / SMA50 | 12,024.10 / 12,291.36 |
| RSI (14) / Stochastic %K | 51.4 / 61.8 |
| Bollinger %B / ATR | 64% / 308.17 |
| Support / Resistance 20 days | 11,650.00 / 12,476.00 |
| Data as of | 15 September 2026 14:00 WIB |



