Alibaba Death Cross Pressure: Stock Drops 0.93% (September 17, 2026)
On September 17, 2026: price 106.20 HKD, trend downtrend, RSI 37.7, support 105.90, resistance 126.20. technical analysis of alibaba stock.

Alibaba Group’s Hong Kong-listed shares fell to HKD 106.20 on HKEX, extending a slide that has left the stock below its SMA20 at 111.83 and SMA50 at 115.50, while the chart now shows a death cross — a bearish signal that appears when the short-term average drops beneath the longer-term one. In plain terms, that means the recent price trend is not just weak; it is weak enough that momentum has already rolled over beneath its own trend markers.
Trend & Price Action
The latest print sits in a clearly damaged structure: Alibaba is trading 1 day -0.93% lower, 5 days -3.28% down, and 1 month -14.49% lower, with the SMA20 slope at -3.50% over 5 days. That slope matters because it shows the average itself is falling, not merely the share price wobbling around a flat line. As shown in the chart, the stock is also positioned under the middle Bollinger band at 111.83, which confirms that the market is spending more time in the lower half of its recent range than recovering toward the center.
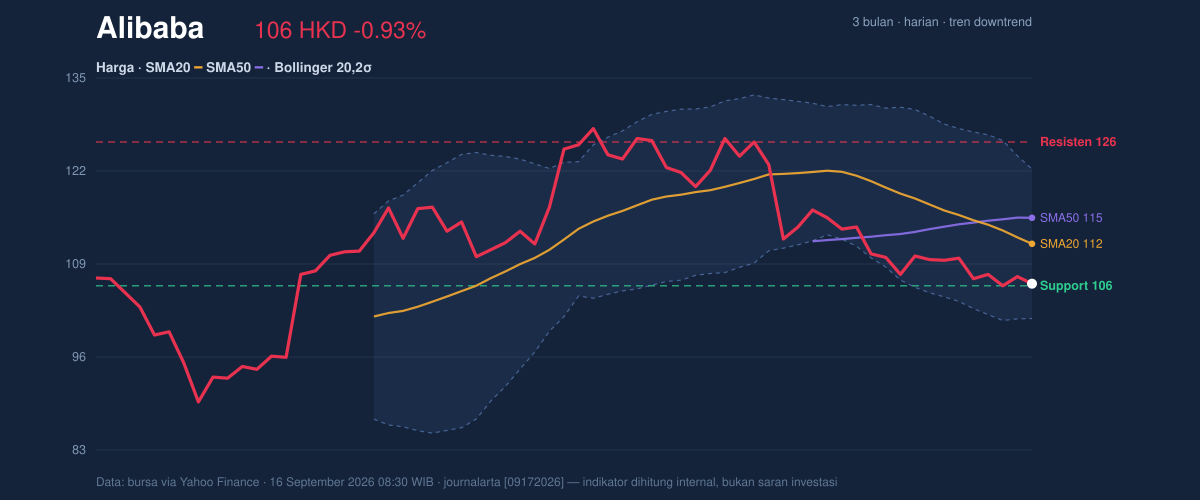
A price below both moving averages, combined with a death cross, usually signals that rallies are being treated as selling opportunities rather than the start of a new advance. The share is also only a short distance above the 20-hour support at 105.90, which means the market is testing the lower edge of its short-term base rather than building above it.
That is not a healthy place for momentum to live.
Oscillators & Momentum
The oscillators are mixed, but not in a reassuring way. RSI at 37.7 is described as neutral, which tells readers the stock is not yet in a classic oversold panic zone. However, the Stochastic %K at 14.6 and %D at 14.5 are both in oversold territory, suggesting the latest selling has pushed the stock toward a stretch where short-term traders may start watching for a bounce. The catch is that oversold does not mean reversal; it only means the decline is getting extended.
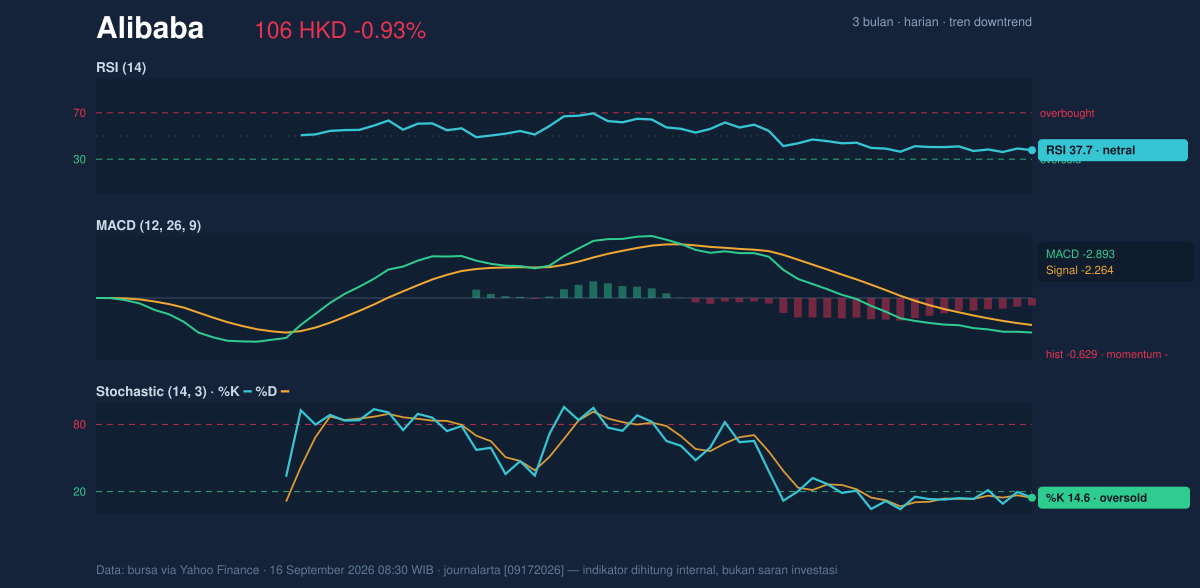
The more important signal is the MACD at -2.893, still below the signal line at -2.264 with a negative histogram of -0.629. That configuration means downside momentum remains in control, even if the stock is short-term stretched. In other words, the oscillator panel is not showing a clean recovery setup yet — it is showing a market that is weak enough to be oversold, but not strong enough to prove a turn.
Volatility & Volume
Bollinger Bands add another layer to the story. The stock is sitting near the lower band at 101.28, with %B at 23%, which places it in the lower quartile of the band structure. That tells us Alibaba is trading near the bottom of its recent volatility envelope, a zone where prices often either stabilize or continue to leak lower if sellers stay active. The band width of 18.9% is described as normal, so this is not a volatility squeeze that usually precedes a sharp expansion. Instead, the market is already in a moderate volatility regime, with room for movement but no sign yet of compression that would hint at an imminent breakout.
Volume is equally telling. Last trade volume was 34,061,594, far below the 20-hour average of 91,585,749, or just 0.4x normal activity. That matters because falling prices on weak volume can mean two different things: either sellers are not fully committed, or buyers are not stepping in with conviction. The OBV is declining, which leans toward the second reading — the balance of accumulation and distribution is still slipping, so the market is not yet showing evidence of sustained demand.
Quiet tape. Weak participation.
Key Levels & Scenarios
The nearest short-term reference points are clear: support at 105.90 and resistance at 126.20. The stock is currently trading within about 1% of the support zone, which makes the next move especially important. If 105.90 gives way, the chart would likely shift from a controlled downtrend into a more vulnerable breakdown phase, especially because the price would then be moving away from the lower Bollinger band rather than stabilizing near it. If that support holds, the first technical hurdle remains the falling middle band at 111.83, then the SMA50 at 115.50, both of which now act as overhead resistance rather than support.
The broader range also frames the market’s current stress. Over the past three months, Alibaba has traded between 130.30 and 88.65, and the current price is closer to the lower end than the upper. That positioning tells readers the stock is not merely pulling back inside a stable range; it is operating in the lower half of a wider, already-pressed range.
Technical Verdict: HOLD (wait & see)
HOLD (wait & see)
- MACD remains negative, with the histogram still below zero, so downside momentum has not yet turned.
- Price is below SMA20 and SMA50, and the death cross confirms the trend is still bearish.
- Stochastic is oversold and price is close to 105.90 support, so the chart is stretched enough to justify waiting for confirmation rather than chasing weakness.
Verdict invalidated if price falls below 105.90.
- Ideal Entry Range: 105.90 to 111.83
- Exit Target (Target Price): 115.50 to 122.38
- Stop Loss protection: below 101.28
For non-traders: the stock is weak, but it is close enough to support that the next move could decide whether this is just a pause or another leg lower.
Alibaba’s Hong Kong shares last closed at HKD 106.20 versus a 20-hour support of HKD 105.90.
Summary Data Alibaba
| Last price | 106.20 HKD |
| Change 1 day / 5 days / 1 month | -0.93% / -3.28% / -14.49% |
| Trend / MA-cross | downtrend / death |
| SMA20 / SMA50 | 111.83 / 115.50 |
| RSI (14) / Stochastic %K | 37.7 / 14.6 |
| Bollinger %B / ATR | 23% / 3.18 |
| Support / Resistance 20 days | 105.90 / 126.20 |
| Data as of | 16 September 2026 08:30 WIB |


