Tencent Stock Drops 1.23% Today, Momentum Weakens
On September 17, 2026: price 433.40 HKD, trend downtrend, RSI 43.9, support 425.60, resistance 457.00. technical analysis of tencent stock.

Tencent Holdings slipped on the Hong Kong exchange on 16 September 2026, with 0700.HK last changing hands at HKD 433.40, down from HKD 438.80 the previous close, as the stock drifted below its short-term average and stayed pinned in the lower quarter of its recent trading range. The move looks modest on the surface, but the signal is more important than the size: Tencent is still trading under its 20-day average, momentum is negative, and volume has not yet come in to challenge the weakness. That combination usually means the market is not rejecting the name outright — it is waiting for proof.
Trend & Price Action
The chart shows Tencent in a downtrend, with the SMA20 at HKD 440.59 and the SMA50 at HKD 454.20, while price sits below the SMA20. That matters because short-term traders often watch the 20-day line as a proxy for whether the stock is regaining control after weakness; staying under it suggests rallies are still being sold rather than embraced. The lack of a new MA-cross also matters: there is no fresh moving-average signal to argue that the trend has turned, and the SMA20 slope at -0.68% over 5 days says the short-term drift is still downward, not flattening.
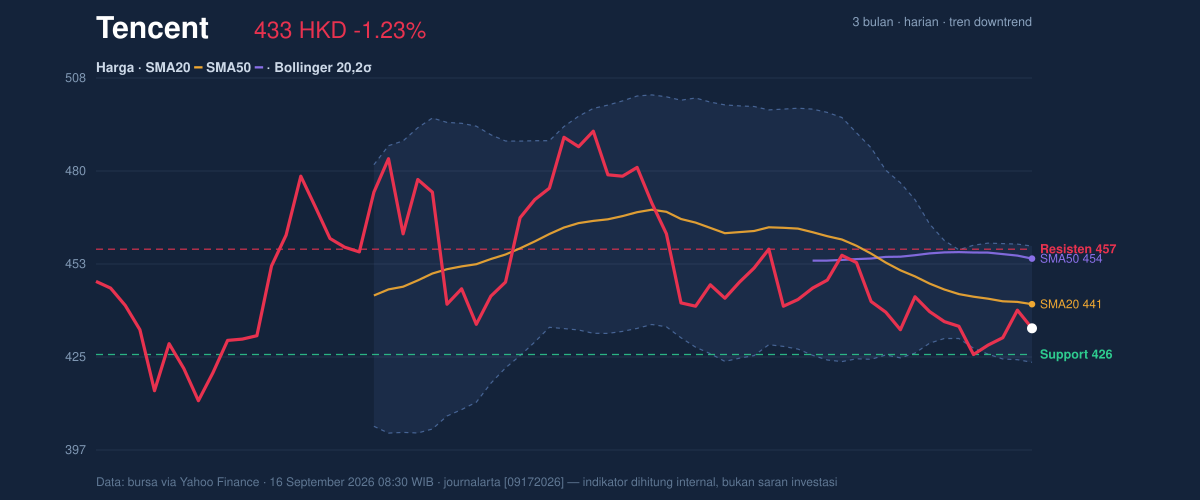
Tencent is also trading in the lower part of its recent band, with support at HKD 425.60 and resistance at HKD 457.00. At HKD 433.40, the stock sits around the lower end of that range, which tells us sellers still have the upper hand, but not by a wide margin. The 3-month range adds context: the stock is well below the 3-month high of HKD 497.80 and still above the 3-month low of HKD 411.00. In plain terms, Tencent is not making new lows, but it has not yet reclaimed the ground that would signal a stronger rebound.
A short move can still matter when it happens near support.
Oscillators & Momentum
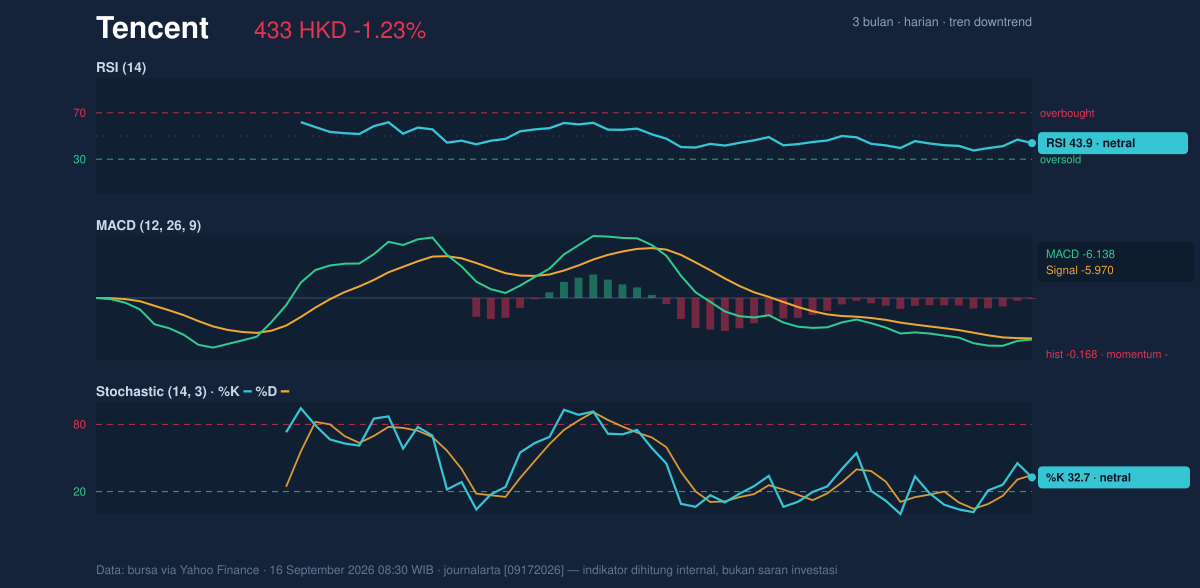
The momentum picture is mixed, but tilted cautious. RSI(14) at 43.9 is neutral, which means the stock is neither stretched nor washed out. That is important because neutral RSI in a downtrend often signals consolidation rather than reversal: the stock is weak, but not yet oversold enough to force bargain-hunting. The Stochastic %K at 32.7 and %D at 34.7 are also neutral, sitting close to the lower half of the scale without flashing an extreme. That shows price is soft, but not at a classic panic point.
The more telling indicator is MACD. Tencent’s MACD at -6.138 remains below the signal line at -5.970, with a histogram of -0.168. In simple terms, the stock’s trend momentum is still negative, and the gap between MACD and signal says downside pressure has not fully faded. This is not a collapse signal; it is a warning that any bounce is still fighting the trend rather than leading it.
Volatility & Volume
The Bollinger Bands show a market that is tightening rather than exploding. The lower band at HKD 423.25, middle band at HKD 440.59, and upper band at HKD 457.93 frame the current move, while %B at 29% places price in the lower part of the band structure. That means Tencent is trading closer to the lower band than the center line, a sign of persistent weakness. But the more interesting clue is that the band width is 7.9%, described as a squeeze. Squeezes often precede larger moves because volatility has compressed; the market is coiling, not resting comfortably. The direction of the next break will matter more than the current drift.
Volatility itself is not excessive. The ATR(14) at 10.44, or 2.4% of price, suggests movement is moderate, not frantic. That means the stock can still travel meaningfully if it leaves the current range, but it is not behaving like a high-stress tape. Volume, however, is not confirming a strong bid: the latest 12,686,315 shares traded versus the 20-day average of 18,176,562, or 0.7x normal. Low participation during weakness often implies conviction is limited, but the OBV is falling, which means the balance of volume has still been favoring distribution rather than accumulation. That is a subtle but important negative: price may be drifting, yet the underlying volume flow is not improving.
Key Levels & Scenarios
The immediate map is clear. HKD 425.60 is the first support to watch, and it sits close to the lower Bollinger band at HKD 423.25. If that floor gives way, the chart would be vulnerable to a deeper slide toward the 3-month low of HKD 411.00. On the upside, HKD 440.59 — the SMA20 and Bollinger middle band — is the first technical hurdle. Reclaiming it would suggest the stock is at least trying to stabilize. Above that, HKD 457.00 and HKD 457.93 form the next resistance cluster; a move through that zone would be the clearest sign that the squeeze is resolving to the upside rather than simply extending the downtrend.
Tencent is not in free fall, but it is still under pressure, and the burden of proof remains with the bulls.
Technical Verdict: HOLD (wait & see)
HOLD (wait & see)
- MACD remains negative, with the histogram still below zero, so downside momentum has not fully cleared.
- Price is below SMA20 and SMA50, which keeps the short-term structure weak despite a neutral RSI.
- Bollinger Bands are squeezing, meaning a larger move may be coming, but direction is not confirmed yet.
Verdict invalidated if price falls below HKD 425.60, because that would break the nearest support and expose the lower range.
- Ideal Entry Range: HKD 425.60–440.59
- Exit Target (Target Price): HKD 457.00–457.93
- Stop Loss protection: below HKD 423.25 or, more conservatively, below HKD 411.00
In plain English: Tencent is still under technical pressure, but the chart is tight enough that the next decisive move could matter more than the current drift.
“The market is waiting for Tencent to prove it can hold the floor before anyone believes the next move is real.”
Summary Data Tencent
| Last price | 433.40 HKD |
| Change 1 day / 5 days / 1 month | -1.23% / -0.14% / -3.09% |
| Trend / MA-cross | downtrend / none |
| SMA20 / SMA50 | 440.59 / 454.20 |
| RSI (14) / Stochastic %K | 43.9 / 32.7 |
| Bollinger %B / ATR | 29% / 10.44 |
| Support / Resistance 20 days | 425.60 / 457.00 |
| Data as of | 16 September 2026 08:30 WIB |


