HSBC Stock Gains 0.81%, Testing Support Level In Focus
On September 17, 2026: price 160.90 HKD, trend sideways, RSI 46.4, support 159.60, resistance 167.60. technical analysis of hsbc stock.

HSBC Holdings’ Hong Kong-listed shares rose 0.81% to HKD 160.90 on 16 September 2026, but the move came with an important caveat: the stock is still trading below its 20-day average at HKD 162.95 and below its 50-day average at HKD 161.46. That matters because it says the latest bounce has not yet changed the broader short-term tone; the market is still treating the rebound as a test of overhead supply rather than a confirmed trend shift. The shares also sit in the lower part of the recent range, with price near 16% of the 20-day band, while the Bollinger setup points to a market that is compressing rather than trending strongly. In plain terms, HSBC is moving, but not convincingly enough to declare a fresh directional break.
Trend & Price Action
The stock’s structure is best described as sideways, with the SMA20 slope only 0.09% over five days. That is a technical way of saying the short-term trend is almost flat: neither buyers nor sellers have fully seized control. The lack of a fresh moving-average crossover reinforces that message. A “golden cross” or “death cross” is a classic signal from moving averages, but here there is no new MA-cross, so the chart is not offering a decisive trend confirmation.
The fact that the share price remains below the SMA20 is more important than the small daily gain. When price trades under a short-term average, rallies often face selling as traders who bought higher look to exit near breakeven. That is why the area around the mid-band at HKD 162.95 and the nearby SMA50 at HKD 161.46 matters: both are not just lines on a chart, but zones where sentiment may need to improve before the market can extend higher.
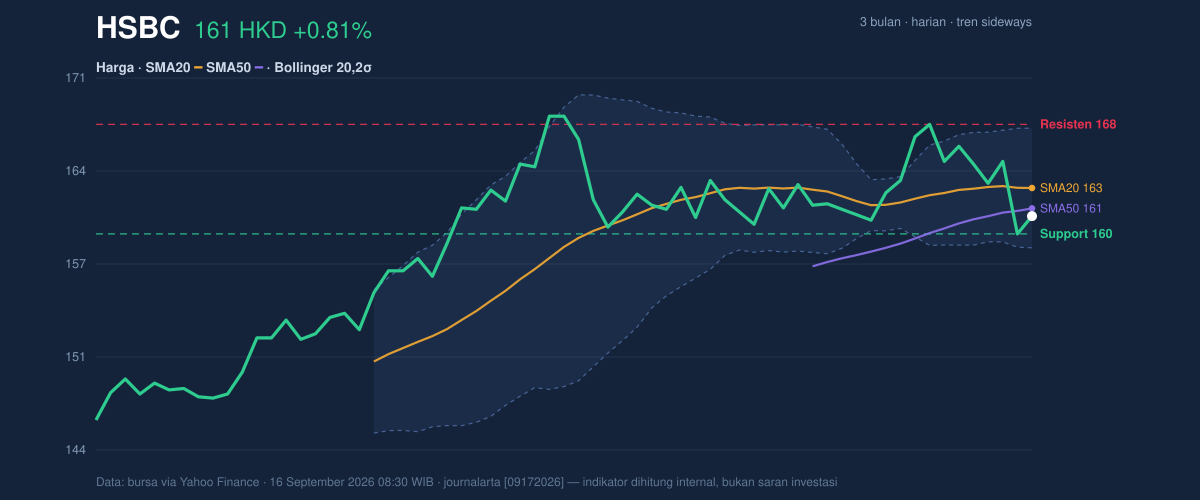
The broader range also gives context. Over the past three months, HSBC has traded between HKD 169.70 and HKD 144.00. The current price is closer to the lower half of that span, which suggests the market has not yet rebuilt enough momentum to challenge the upper end of the range. The latest one-day gain is real, but it still sits inside a larger consolidation pattern.
Oscillators & Momentum
Momentum indicators are mixed, and that is the key signal. RSI at 46.4 is neutral, meaning the stock is neither overbought nor oversold. That usually points to balance, but in this case it also tells us the rebound has not generated enough strength to push momentum into a more bullish zone. Meanwhile, Stochastic %K at 23.1 and %D at 33.0 show the stock is leaning toward the lower end of its recent range without yet triggering a clear reversal. Stochastic often reacts faster than RSI, so its lower reading can hint at a short-term bounce setup, but only if price starts to confirm it.
The most cautionary signal comes from MACD at 0.483 below the signal line at 0.986, leaving a negative histogram of -0.504. MACD is a trend-following momentum gauge, and this configuration means the recent price action still lacks upside force. In practical terms, the stock may be stabilising, but the underlying momentum has not yet turned decisively positive.
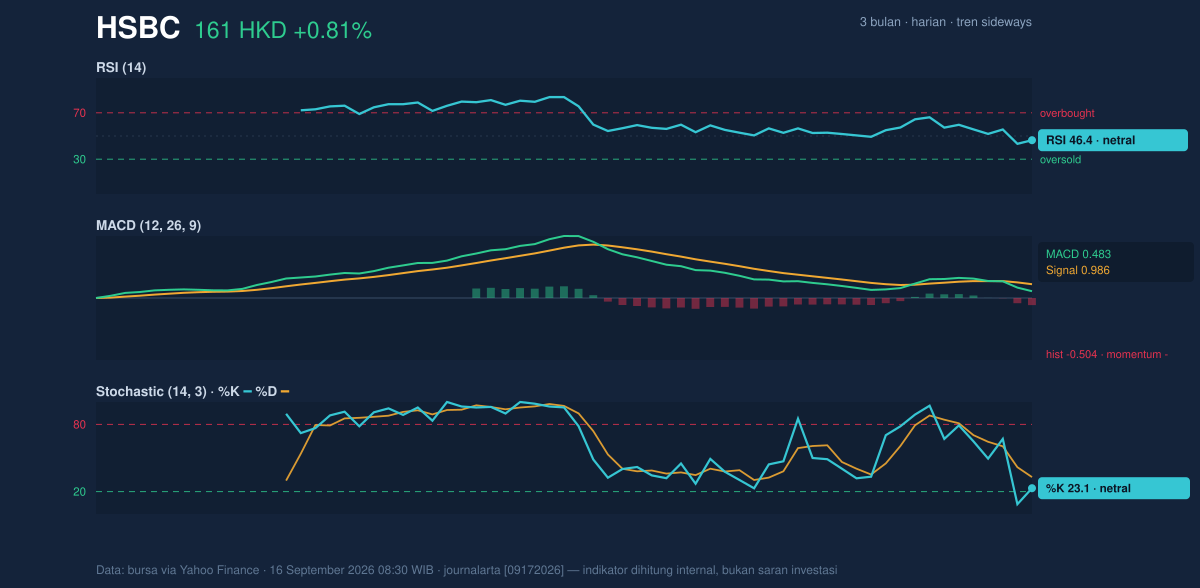
This combination — neutral RSI, soft Stochastic, and negative MACD histogram — usually fits a market that is waiting for a catalyst rather than one already in motion.
Volatility & Volume
Volatility is present, but not elevated enough to imply disorder. ATR(14) at 2.59, or 1.6% of price, indicates moderate volatility. ATR measures the average daily trading range, so this reading suggests the stock can move, but not in a way that screams panic or euphoria. More interesting is the Bollinger setup: the band width is only 5.4% and is narrowing, which is consistent with a squeeze. A squeeze does not predict direction by itself; it means the market is coiling, and a larger move becomes more likely once price leaves the compression zone.
Price sits at %B 26%, which means it is closer to the lower Bollinger band at HKD 158.59 than to the upper band at HKD 167.32. That positioning matters because it shows the stock is not stretched on the upside. Instead, it is hovering near the bottom of its near-term volatility envelope, where either support can hold and invite a rebound, or a break can accelerate weakness.
Volume has been softer than usual: 6,192,853 shares traded versus a 20-day average of 10,279,051, or about 0.6× normal. Low volume on a bounce often means conviction is limited. However, OBV is rising, which is a constructive detail because on-balance volume tracks whether money flow is accumulating despite quieter trading. That divergence suggests some buyers are still stepping in, even if the broader market has not yet shown strong participation.
Key Levels & Scenarios
The immediate technical map is clear. Support at HKD 159.60 is the first level to watch, because it aligns closely with the lower end of the recent trading zone and sits just beneath the current price. If that floor holds, the stock has room to attempt a move back toward HKD 161.46 and HKD 162.95, where the 50-day and 20-day averages may act as resistance. Above that, HKD 167.60 is the next meaningful barrier, closely matching the upper Bollinger band at HKD 167.32. A push through that area would signal that the squeeze is starting to resolve upward.
If HKD 159.60 fails, the chart would likely lose its near-term base and shift attention toward the lower Bollinger band at HKD 158.59. That would be a sign that the current sideways phase is resolving in the wrong direction. The fact that the price is already trading below the short-term averages means the burden of proof remains with the bulls.
Technical Verdict: HOLD (wait & see)
HOLD (wait & see) fits the chart because the stock is in a squeeze-like setup, but the momentum picture is not yet strong enough to confirm an upside break. MACD remains negative, price is below the SMA20, and volume is only 0.6× normal, all of which argue against treating the bounce as decisive. On the other hand, OBV is rising and the Bollinger bands are narrowing, which means the market is coiling and could move more sharply once a direction is chosen. The verdict is invalidated if price falls below HKD 159.60, because that would break the nearest support and weaken the current base.
- Ideal Entry Range: HKD 159.60 to HKD 161.46
- Exit Target: HKD 167.32 to HKD 167.60
- Stop Loss Protection: Below HKD 158.59
For non-traders: HSBC is still stuck in a tight range, and the chart needs a stronger move above resistance before the recent bounce can be treated as more than a pause.
Newest hard fact: the latest close was HKD 160.90, with volume at 6,192,853 shares against a 20-day average of 10,279,051.
Summary Data HSBC
| Last price | 160.90 HKD |
| Change 1 day / 5 days / 1 month | 0.81% / -3.07% / -0.19% |
| Trend / MA-cross | sideways / none |
| SMA20 / SMA50 | 162.95 / 161.46 |
| RSI (14) / Stochastic %K | 46.4 / 23.1 |
| Bollinger %B / ATR | 26% / 2.59 |
| Support / Resistance 20 days | 159.60 / 167.60 |
| Data as of | 16 September 2026 08:30 WIB |


