UOB Stock Drops 0.29% Today, Momentum Gains
On September 17, 2026: price 41.21 SGD, trend sideways, RSI 46.7, support 40.22, resistance 42.33. technical analysis of uob stock. UOB Stock Drops — full…

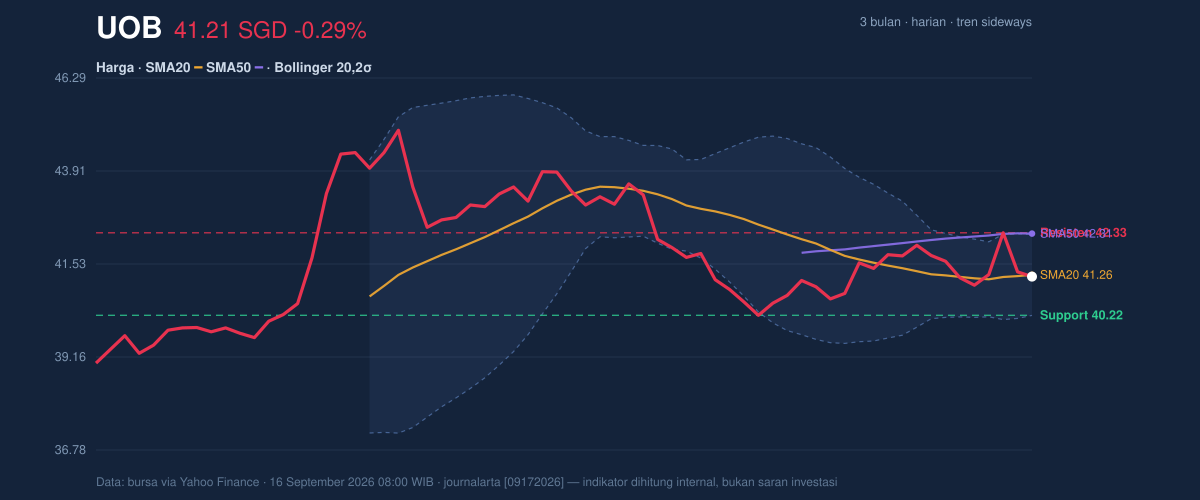
United Overseas Bank shares on SGX edged lower to SGD 41.21 on 16 September 2026, slipping from SGD 41.33 as the stock stayed trapped in a narrow range that looks more like consolidation than a fresh trend. The move leaves UOB just below its SMA20 at SGD 41.26 and well under its SMA50 at SGD 42.31, a positioning that tells investors the stock has not yet rebuilt enough upward momentum to challenge the longer-term average. As shown in the chart, the setup is now being defined less by direction and more by whether the current squeeze in volatility resolves upward or fails at nearby resistance.
Trend & Price Action
The broader picture remains sideways, and that matters because sideways markets often act as a pause after a prior move rather than a clean reversal signal. UOB’s SMA20 slope of 0.13% over five days suggests the short-term drift is only mildly improving, but the fact that price is still below the SMA20 means buyers have not yet taken back control. The stock has also made little progress over the past week, with a 5-day change of 0.07%, while the 1-month gain of 1.60% shows there is some underlying resilience, just not enough to force a breakout.
The placement inside the range is also telling. UOB is sitting at about 47% of its 20-hour range, which is close to the middle rather than near the upper edge, so the market is not pricing in strong immediate upside pressure. The 3-month high of SGD 45.15 and 3-month low of SGD 38.47 frame the current move as a mid-range consolidation, not a trend extension. That makes the nearby bands and moving averages especially important, because they are likely to decide the next directional move.
Oscillators & Momentum
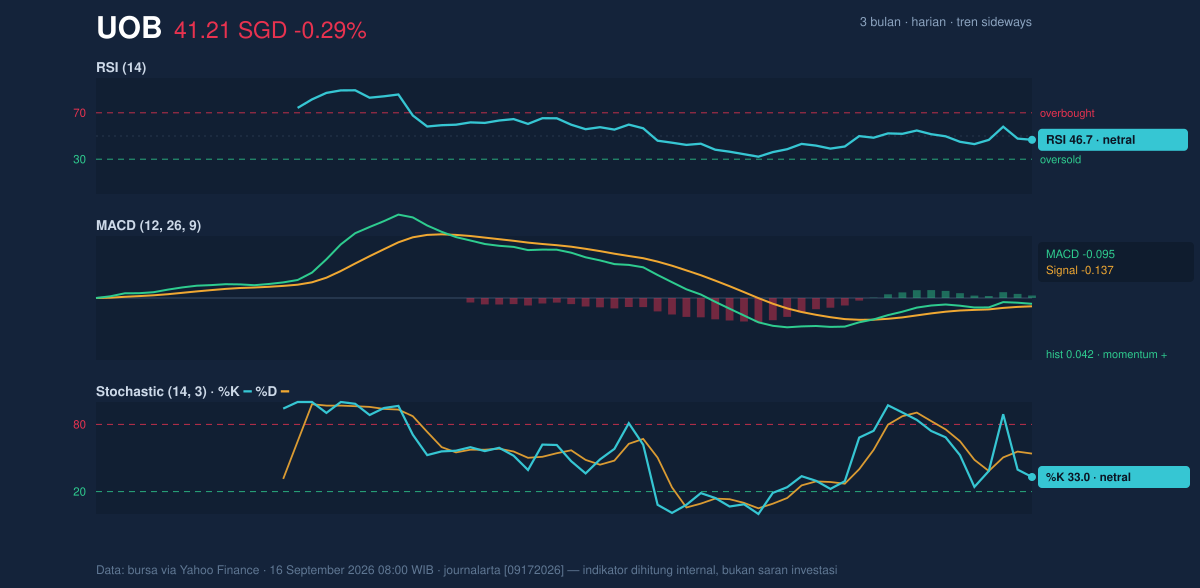
Momentum is mixed, but not broken. The RSI at 46.7 is neutral, which means the stock is neither overbought nor oversold and has room to move either way without immediately running into technical fatigue. The Stochastic %K at 33.0 versus %D at 53.9 is also neutral, but it leans softer in the short term because the faster line sits below the slower line; that usually signals fading near-term enthusiasm rather than a decisive bearish turn.
The more constructive element is the MACD. UOB’s MACD at -0.095 is still below zero, so the broader momentum backdrop has not fully turned positive, but the histogram at 0.042 and the fact that the MACD line is above the signal line at -0.137 point to improving internal momentum. In plain language, the stock is not yet strong, but the rate of decline has eased enough to suggest buyers are trying to stabilise the tape. As shown in the chart, this is the kind of early improvement that often matters more than the headline MACD level itself.
Volatility & Volume
The volatility picture is unusually calm. UOB’s ATR(14) at 0.62, or 1.5% of price, indicates low day-to-day movement, which often precedes a larger shift once the market chooses a direction. That reading lines up with the Bollinger Band width of 5.0%, described as a squeeze, meaning the bands have tightened and the stock is coiling rather than trending. The %B at 48% places price almost exactly in the middle of the band structure, reinforcing the idea that the market is waiting for a catalyst instead of already committing to one side.
Volume does not yet confirm a breakout attempt. The latest turnover of 2,652,000 shares was below the 20-day average of 2,830,530, or about 0.9x normal, so the latest move has not been backed by stronger participation. That matters because breakouts in tight ranges are more credible when volume expands; here, the quieter tape suggests caution. The OBV is down, which means cumulative volume flow has been leaning out of the stock even though price has not fallen sharply. That divergence often warns that rallies may struggle unless buyers return with conviction.
Key Levels & Scenarios
The nearest technical floor is the support at SGD 40.22, which also matches the lower Bollinger Band. That makes it a meaningful line in the sand: if price slips through it, the squeeze may resolve downward rather than upward. On the upside, the immediate ceiling is the resistance at SGD 42.33, sitting just above the SMA50 at SGD 42.31 and near the upper Bollinger Band at SGD 42.29. When resistance, moving average, and band top cluster so closely, they form a heavier barrier than any one level alone.
The current structure therefore hinges on whether UOB can reclaim the low-42s with better participation. If it does, the chart would start to look less like a stalled range and more like an attempted recovery toward the upper part of its recent band. If it fails, the stock may continue to drift around the middle of the range while the bearish OBV signal keeps pressure on rallies.
Technical Verdict: HOLD (wait & see)
HOLD (wait & see) because the chart is balanced between a mild momentum improvement and a still-unconfirmed trend. The strongest reasons are: MACD is positive relative to its signal line, which shows momentum is improving; RSI at 46.7 and Stochastic at 33.0/53.9 are neutral, so neither side has clear control; and price remains below SMA20 and SMA50 while volume runs at 0.9x normal, which weakens the case for a clean move. The verdict is invalidated if price breaks below SGD 40.22, because that would mean the support and lower Bollinger Band have failed together.
- Ideal Entry Range: SGD 40.22 to 42.33, with the lower end offering support and the upper end requiring confirmation.
- Exit Target: SGD 42.33 first, then the SMA50 at SGD 42.31 as the immediate technical hurdle cluster.
- Stop Loss protection: below SGD 40.22, where the support and lower band sit.
In plain English: the stock looks like it is waiting for a clear move, not already making one.
Summary Data UOB
| Last price | 41.21 SGD |
| Change 1 day / 5 days / 1 month | -0.29% / 0.07% / 1.60% |
| Trend / MA-cross | sideways / none |
| SMA20 / SMA50 | 41.26 / 42.31 |
| RSI (14) / Stochastic %K | 46.7 / 33.0 |
| Bollinger %B / ATR | 48% / 0.62 |
| Support / Resistance 20 days | 40.22 / 42.33 |
| Data as of | 16 September 2026 08:00 WIB |


