Golden Cross Formed, AIA Stock Gains 1.25% Today
On September 17, 2026: price 77.00 HKD, trend uptrend, RSI 57.3, support 72.75, resistance 77.50. technical analysis of aia stock. Golden Cross Formed — full…

AIA Group rose to 77.00 HKD on HKEX, up 1.25% from the previous close of 76.05, and the move matters more than the size of the gain. The stock is now trading above both its short- and medium-term averages, with a golden cross already in place, a classic signal that recent buying pressure has overtaken the slower trend. As shown by the chart, the shares are also sitting close to the upper half of their recent trading band, which tells investors the market is no longer merely recovering — it is testing whether that recovery can extend.
Trend & Price Action
The broader structure remains constructive. AIA is in an uptrend, supported by the SMA20 at 75.70 and the SMA50 at 75.52, with price holding above both. That positioning is important because it suggests the market is willing to pay up for the shares rather than treating rebounds as short-lived. The SMA20 slope of 1.13% over 5 days reinforces that point: the shorter average is still rising, so the trend is not only intact but improving.
The stock’s location within its recent range is also telling. At 77.00, AIA is trading near the top of its 20-hour resistance at 77.50 and well above the 20-hour support at 72.75. It is also closer to the 3-month high of 80.15 than the 3-month low of 69.35, which means the market has already repaired much of the damage from the earlier slide. That does not guarantee a clean breakout, but it does show the burden of proof has shifted to sellers.
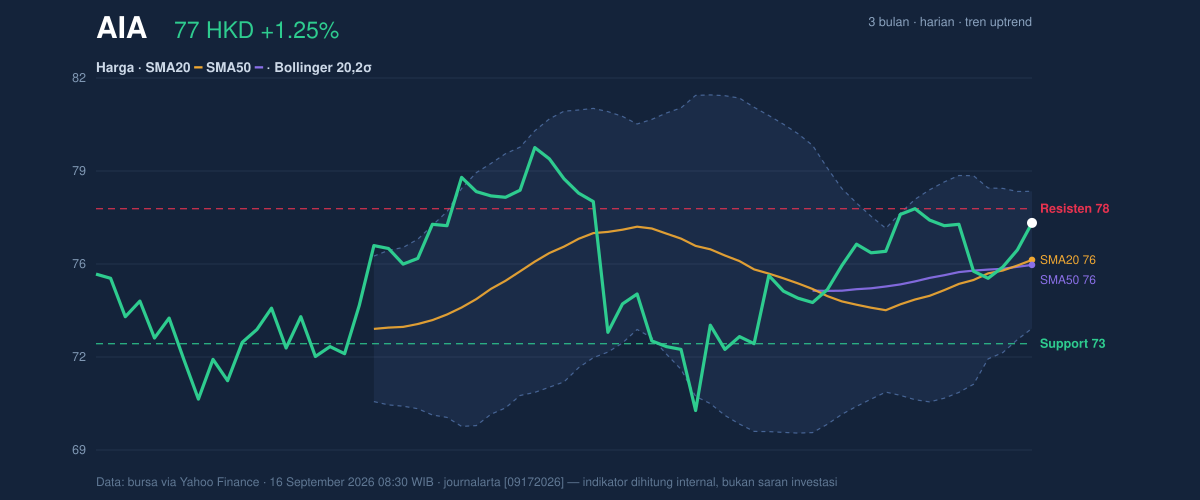
The Bollinger Bands add another layer. Price is at %B 77%, which means it is trading above the middle band and moving toward the upper band at 78.11. More importantly, the band width is only 6.4%, a squeeze that often signals stored energy rather than exhaustion. In plain language, a narrow band says the stock has been moving in a tighter range and may be preparing for a larger move once one side wins control.
Oscillators & Momentum
The momentum picture is supportive, but not euphoric. The RSI at 57.3 is neutral, which is healthy in an uptrend because it suggests the stock is not yet stretched into overbought territory. That matters: strong trends often fail not because momentum is weak, but because they become too crowded too quickly. Here, the RSI leaves room for continuation if buyers keep stepping in.
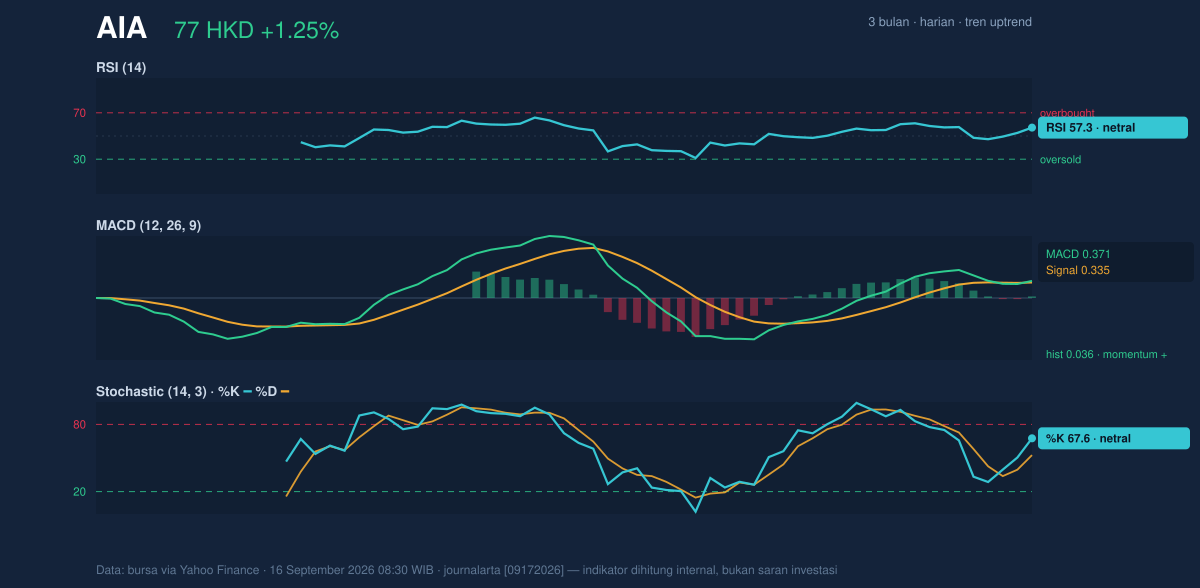
The Stochastic %K at 67.6 and %D at 52.6 also sit in neutral territory, but with %K above %D, the short-term momentum is still leaning positive. This is not a breakout signal on its own, yet it does show that recent closes have been stronger than the prior average pace. The MACD at 0.371 above its signal line at 0.335, with a positive histogram of 0.036, is the clearest confirmation in the set. In technical terms, MACD turning positive means the faster trend is outpacing the slower one, and the histogram above zero says that advantage is still intact.
Volatility & Volume
Volatility is moderate, not extreme. The ATR(14) of 1.62, equal to 2.1% of price, suggests AIA can move enough to matter without implying panic-driven swings. That is useful in a stock testing resistance, because a moderate ATR can allow a measured push higher without requiring a dramatic gap move.
Volume, however, is less emphatic. Last traded volume of 24,680,344 was below the 20-day average of 26,810,173, or 0.9x normal. That means the latest rise did not come with a full conviction surge. The good news is that OBV is rising, which indicates that, over time, more volume has been associated with up days than down days. In other words, participation is still tilting bullish even if the latest session was not unusually heavy. As shown in the chart, that combination often precedes either a controlled grind higher or a false start if resistance holds firm.
Key Levels & Scenarios
The near-term map is clear. 77.50 is the immediate barrier, and a sustained move through it would open the way toward the upper Bollinger band at 78.11 and then the 3-month high at 80.15. On the downside, 75.70 is the first important pivot because it matches the middle Bollinger band and the SMA20. If that gives way, the stock would likely shift back into a more defensive posture, with 72.75 becoming the key support to watch.
The signal set is balanced but still tilted upward. Trend structure is positive, momentum is constructive, and volatility is compressed enough to keep the door open for expansion. The missing ingredient is stronger participation, because volume has not yet confirmed the move with force. AIA is technically constructive, but the stock still needs a decisive break above resistance to turn a good setup into a stronger trend continuation.
Technical Verdict: HOLD (wait & see)
HOLD (wait & see)
- Golden cross and price above SMA20 75.70 and SMA50 75.52 keep the trend positive.
- MACD 0.371 above signal 0.335 and a positive histogram 0.036 confirm momentum is still leaning upward.
- Bollinger squeeze with price at %B 77% suggests a move may be brewing, but volume at 0.9x normal means confirmation is still incomplete.
Verdict invalidated if price breaks below 72.75.
- Ideal Entry Range: 75.70 to 77.00 HKD
- Exit Target: 78.11 to 80.15 HKD
- Stop Loss protection: 72.75 HKD
In plain English: the chart is leaning positive, but it is still waiting for proof that buyers can push through resistance.
The latest resistance level remains 77.50 HKD.
Summary Data AIA
| Last price | 77.00 HKD |
| Change 1 day / 5 days / 1 month | 1.25% / 0.06% / 5.48% |
| Trend / MA-cross | uptrend / golden |
| SMA20 / SMA50 | 75.70 / 75.52 |
| RSI (14) / Stochastic %K | 57.3 / 67.6 |
| Bollinger %B / ATR | 77% / 1.62 |
| Support / Resistance 20 days | 72.75 / 77.50 |
| Data as of | 16 September 2026 08:30 WIB |


