RSI Overbought, Shell Stock Drops 0.15% Today
On September 17, 2026: price 3,576.50 GBp, trend uptrend, RSI 76.5, support 3,311.00, resistance 3,652.50. technical analysis of shell stock.

Shell plc edged lower on the London Stock Exchange on 15 September, with the shares last changing hands at 3,576.50 GBp, down 0.15% from the previous close of 3,582.00, even as the broader tape still shows a firm upward bias. The move matters less for its size than for where it sits in the pattern: Shell is trading above its short- and medium-term averages, but momentum gauges are flashing that the rally has become stretched. That combination often means the market is still trending higher, yet any fresh advance is increasingly dependent on whether buyers can absorb profit-taking near the top of the recent range.
Trend & Price Action
Shell remains in an uptrend, and the slope of the SMA20 at 1.78% over 5 days shows the shorter trend is still rising rather than flattening out. The shares are also trading above the SMA20 at 3,450.88 and above the SMA50 at 3,328.72, which is the classic sign that the market is still accepting higher prices. There is no new MA-cross, so the chart is not showing a fresh acceleration signal; instead, the current move looks like an established trend that is being tested by overbought conditions.
The price is also sitting near the upper end of its recent band, at about 78% of the 20-hour range, with the 20-hour resistance at 3,652.50 just above the current level and the 20-hour support at 3,311.00 below. That positioning is important: when a stock is this high in its range, it usually means the market has already priced in a good deal of near-term optimism, and the next leg higher needs fresh demand rather than simple trend inertia.
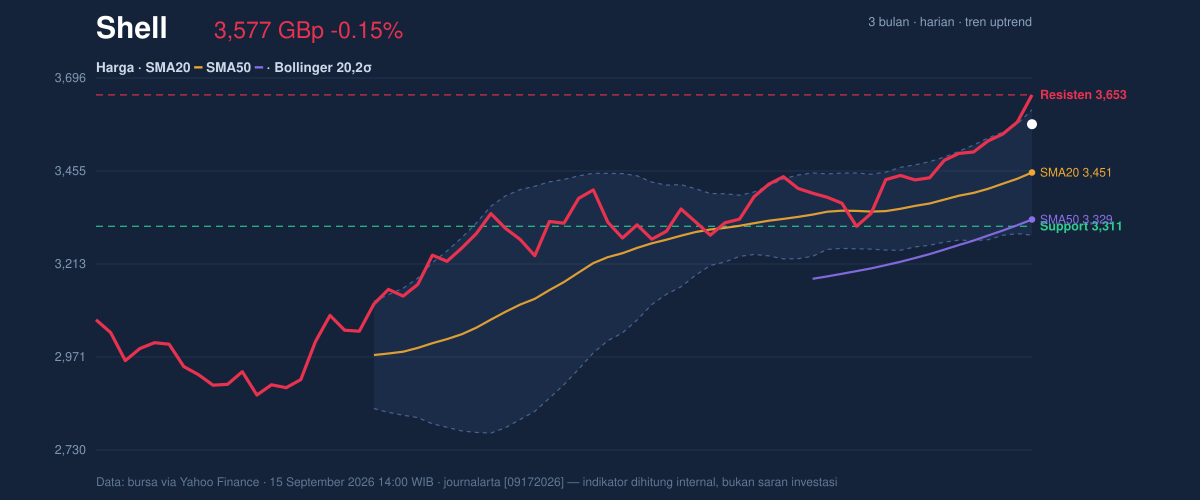
As shown in the chart, the price is pressing into the upper Bollinger area, which often signals strength, but also warns that the easy part of the move may already be behind it. The 3-month high is 3,652.50, so Shell is trading close to a level where prior supply has already appeared. The 3-month low is 2,559.50, which underlines how far the stock has recovered, but that historical rebound also makes the current stretch more vulnerable to consolidation.
Oscillators & Momentum
The momentum picture is less comfortable than the trend picture. The RSI(14) at 76.5 is in overbought territory, which does not automatically mean a reversal is imminent, but it does mean the recent pace of buying has become unusually fast. In plain terms, the market has been enthusiastic enough that it may need to pause before it can climb further.
The stochastic oscillator is even more extreme, with %K at 100.0 and %D at 93.2, also overbought. That tells readers the stock is closing near the top of its recent range almost every time it trades, a pattern that often accompanies strong momentum but can also precede a short cooling-off period if buyers stop chasing.
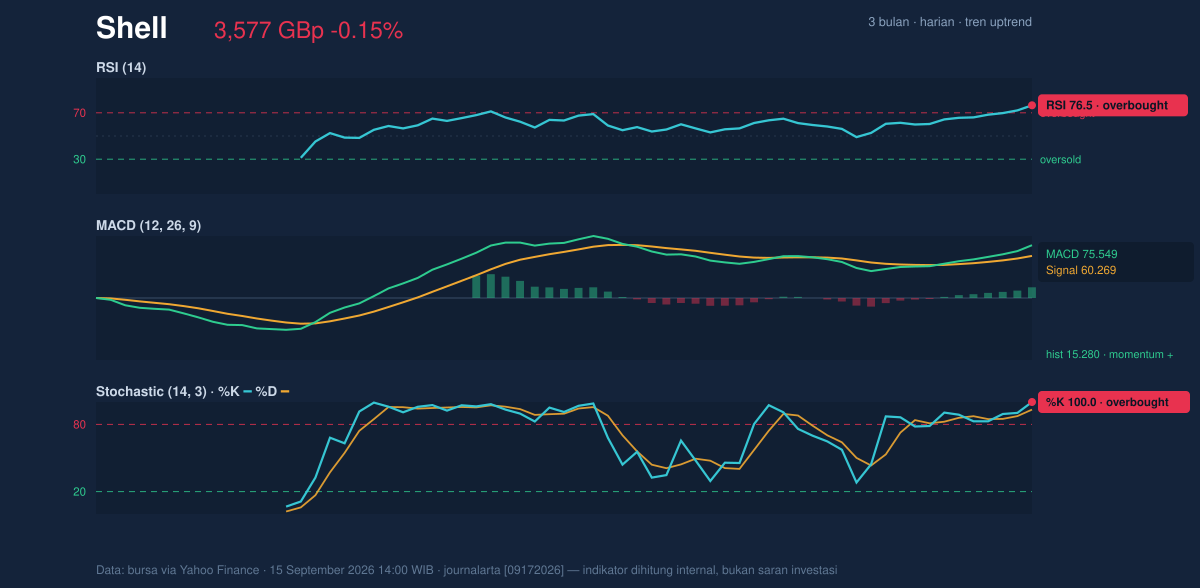
The MACD at 75.549 remains above the signal line at 60.269, and the histogram at 15.280 is positive, which means underlying momentum is still aligned with the uptrend. This is the key tension in Shell right now: the trend is intact and momentum is still positive, yet the oscillators are so elevated that the market looks more extended than healthy. In technical terms, the stock is not losing strength, but it is no longer cheap in momentum terms either.
Volatility & Volume
Volatility is behaving in a controlled way rather than in a panic phase. The ATR(14) at 62.23, equal to 1.7% of price, points to moderate volatility, which means daily swings are present but not disorderly. The Bollinger Band width of 9.4% is described as normal, so this is not a volatility squeeze that usually precedes a sharp breakout, nor is it an expansion that screams a decisive trend event.
The price is also sitting at %B 89%, close to the upper band at 3,613.90. That is a useful signal: it shows Shell is trading near the top of its statistical envelope, which often reflects strength, but it also means the shares are stretched relative to the recent mean at 3,450.88. When price hugs the upper band while RSI and stochastic are overbought, the market is usually telling you the trend is strong but mature.
Volume adds a cautionary note. Last session volume was 5,901,803, below the 20-hour average of 10,457,111, or about 0.6×, which suggests the latest move was not backed by broad participation. That matters because a rising price on lighter volume can still work, but it is less convincing than a rally supported by heavier trading. The OBV is rising, though, so the longer-running balance of buying pressure remains constructive even if the most recent session was quiet.
Key Levels & Scenarios
The immediate technical map is clear. 3,652.50 is the first major ceiling because it matches both the 20-hour resistance and the 3-month high. If Shell can move through that area, it would signal that buyers are willing to pay above the recent peak rather than merely defend it. Below that, 3,450.88 is the first meaningful trend support because it is the SMA20 and also the Bollinger midline, making it the level that separates a healthy pullback from a deeper loss of momentum. Further down, 3,328.72 marks the SMA50, and 3,311.00 is the near-term support that would matter if the rally starts to unwind.
If price holds above the SMA20 and consolidates under resistance, that would look like a normal pause within an uptrend. If it loses the SMA20 and slips toward the SMA50, the market would be saying the recent overbought condition is being worked off rather than extended.
Technical Verdict: HOLD (wait & see)
Shell’s chart still points upward, but the setup is too extended to call it cleanly directional. The verdict is HOLD (wait & see) because the trend remains positive, yet RSI at 76.5 and Stochastic at 100.0/93.2 show the stock is overbought, while volume at 0.6× average does not yet confirm a fresh breakout. The MACD remains positive, so momentum has not broken, but the price is already near the 3,652.50 ceiling and close to the upper Bollinger band.
- Ideal Entry Range: 3,450.88 to 3,311.00
- Exit Target (Target Price): 3,613.90 to 3,652.50
- Stop Loss protection: below 3,311.00
This means the shares are still technically strong, but the chart is asking for proof before the next move can be trusted.
“Right now Shell is still climbing, but the market is starting to ask whether the buyers have enough fuel left for another push.”
Summary Data Shell
| Last price | 3,576.50 GBp |
| Change 1 day / 5 days / 1 month | -0.15% / 2.17% / 7.42% |
| Trend / MA-cross | uptrend / none |
| SMA20 / SMA50 | 3,450.88 / 3,328.72 |
| RSI (14) / Stochastic %K | 76.5 / 100.0 |
| Bollinger %B / ATR | 89% / 62.23 |
| Support / Resistance 20 days | 3,311.00 / 3,652.50 |
| Data as of | 15 September 2026 14:00 WIB |



