BP RSI Overbought: Stock Drops 0.77% (September 17, 2026)
On September 17, 2026: price 566.80 GBp, trend uptrend, RSI 70.3, support 514.50, resistance 580.30. technical analysis of bp stock. BP RSI Overbought — full…

BP plc is trading near the top of its recent range, but the signal mix is getting tighter: the shares are still in an uptrend, yet momentum is stretched and the next move may depend on whether buyers can clear the recent ceiling or simply pause and digest gains.
BP.L last changed hands at 566.80 GBp, down 0.77% on the day after a 3.04% rise over five days and a 9.08% gain over one month, according to market data from Yahoo Finance via the London Stock Exchange. That combination matters. It says the stock has been climbing with enough persistence to keep the trend intact, but the latest slip also shows the market is no longer moving in a straight line. For international readers, the key point is that BP is not in a reversal; it is in a strong advance that is now running into the usual problem of strength: overextension.
Trend & Price Action
The broader structure still favours the bulls. BP is trading above its SMA20 at 544.37 and above its SMA50 at 531.06, which is the classic sign that short-term price action remains above the market’s recent average and medium-term average. The uptrend is supported by the SMA20 slope of 1.94% over five days, a useful signal that the shorter average is still rising rather than flattening out. There is no new MA-cross, so the chart is not flashing a fresh trend-change signal; instead, it is showing a trend that has already been established and is still being tested.
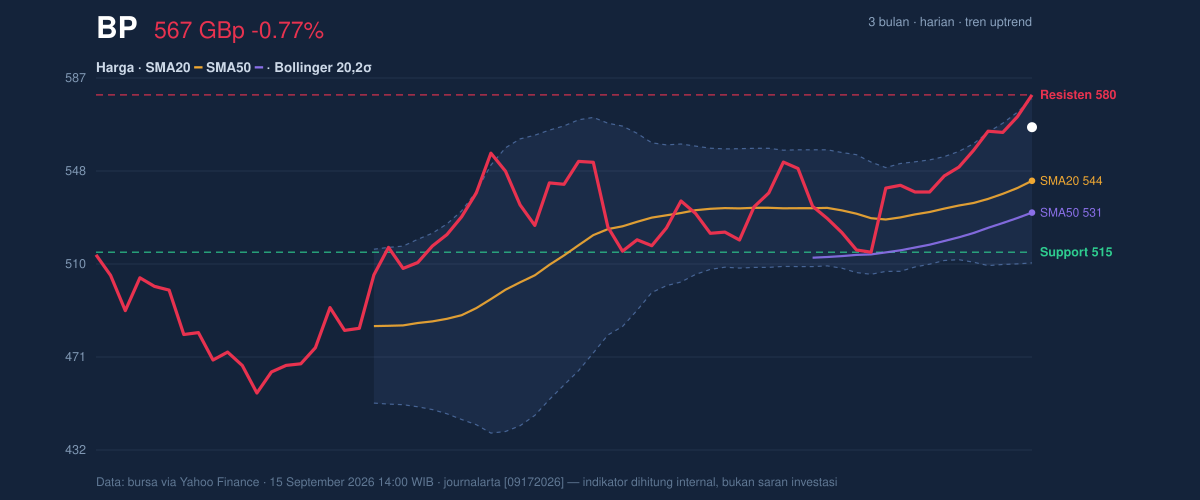
The price is also sitting near the upper end of its recent band: it is 79% of the 20-hour range, with support at 514.50 and resistance at 580.30. That positioning is important because it tells us the market has already absorbed much of the available upside in the current swing. The 3-month high at 580.30 is especially significant: BP is now pressing directly against the same level that has capped the move before. In plain English, the stock is close enough to the top of the hill that any further progress needs fresh buying, not just momentum carry-over.
Oscillators & Momentum
The momentum tools are strong, but they are also warning that the advance is crowded. RSI at 70.3 is in overbought territory, which does not mean the stock must fall, but it does mean recent gains have been fast enough to raise the odds of a pause. Stochastic %K at 100.0 and %D at 92.1 are also overbought, and that matters because Stochastic measures where price sits within its recent range. Read together, these indicators say BP is not cheap on a short-term basis and is vulnerable to mean reversion if buying momentum cools.
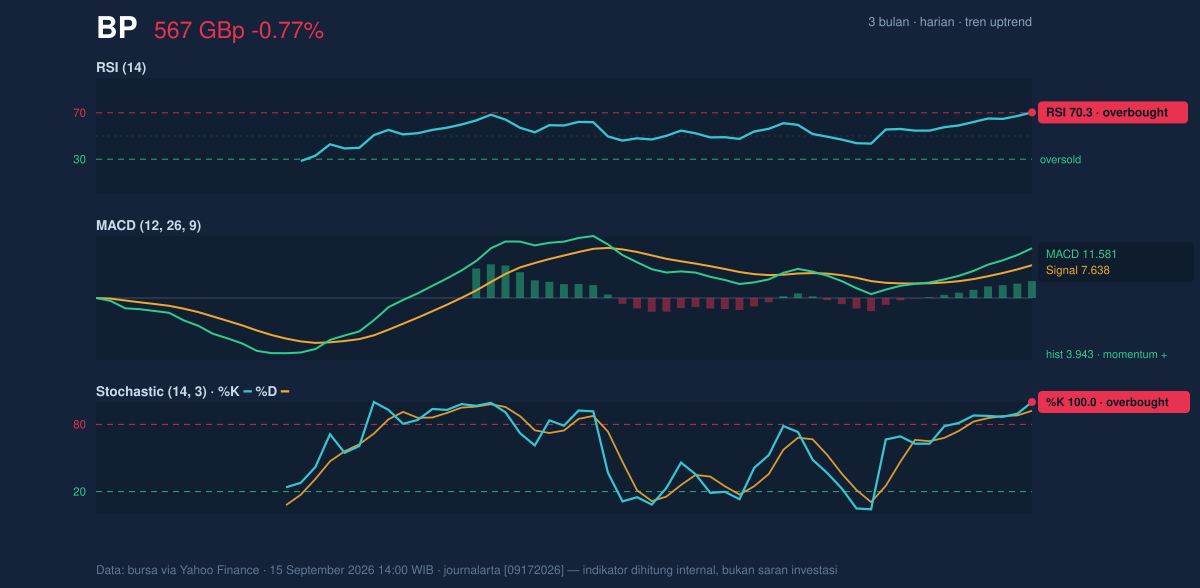
The more encouraging counterweight is the trend-following side of the setup. MACD at 11.581 remains above its signal line at 7.638, with a histogram of 3.943. That is a clean positive reading: it shows the shorter-term trend is still stronger than the slower trend, and the gap between the lines suggests momentum remains constructive. So while RSI and Stochastic are flashing “extended,” MACD is still saying “trend intact.” That split is often what a mature rally looks like: strong enough to keep climbing, but stretched enough to become sensitive to any disappointment.
Volatility & Volume
Volatility is not elevated enough to suggest disorder, but it is active enough to matter. ATR(14) at 16.35, or 2.9% of price, points to moderate volatility. That implies BP can still move decisively without needing a market shock, yet the current range is not wide enough to justify complacency. The Bollinger Band width of 12.6% is described as normal, which suggests the stock is not in a squeeze that would usually precede a dramatic breakout, nor in a wide expansion that would signal panic or exhaustion. The price sits at %B 83%, meaning it is trading close to the upper Bollinger band at 578.72. That is another way of saying the stock is near the top of its statistically expected range.
Volume adds an important layer of confirmation. Last volume was 90,727,223, about 2.0× the 20-day average of 45,900,510, and OBV is rising. That is a meaningful signal. Heavy turnover on an advance usually means the move is being supported by broad participation rather than a thin, speculative push. Rising OBV, which tracks whether volume is accumulating on up days, reinforces the idea that buyers have been present consistently. In other words, the rally is not just price-led; it has participation behind it.
Key Levels & Scenarios
The market is now boxed between nearby support and the recent high. Support at 544.37 — the SMA20 and Bollinger middle band — is the first level to watch because it sits at the centre of the current trend structure. If BP holds above that area, the uptrend remains orderly. A failure there would suggest the stock is losing short-term momentum and may drift toward the next floor at 531.06, the SMA50. On the upside, 580.30 is the immediate resistance and the 3-month high. A clean move through that level would signal the market is willing to pay up beyond the recent range, while repeated failures there would reinforce the idea that the rally needs consolidation before any further extension.
The chart shows a stock that is trending well but has reached the point where momentum and resistance are starting to meet.
Technical Verdict: HOLD (wait & see)
HOLD (wait & see)
- MACD remains positive, with the line above the signal line and a positive histogram, which supports the underlying uptrend.
- Price is above SMA20 and SMA50, confirming the broader trend is still constructive.
- RSI at 70.3 and Stochastic at 100.0 / 92.1 show the move is overbought, while price is pressing into 580.30 resistance, so upside may be harder to extend immediately.
Verdict invalidated if price breaks below 544.37, because that would put BP back under the short-term trend line and weaken the current bullish structure.
- Ideal Entry Range: 544.37 to 531.06
- Exit Target: 578.72 to 580.30
- Stop Loss protection: below 531.06, with 514.50 as the deeper support reference
In plain English: BP still looks strong, but it is stretched enough that the next move may be a pause rather than a fresh surge.
Summary Data BP
| Last price | 566.80 GBp |
| Change 1 day / 5 days / 1 month | -0.77% / 3.04% / 9.08% |
| Trend / MA-cross | uptrend / none |
| SMA20 / SMA50 | 544.37 / 531.06 |
| RSI (14) / Stochastic %K | 70.3 / 100.0 |
| Bollinger %B / ATR | 83% / 16.35 |
| Support / Resistance 20 days | 514.50 / 580.30 |
| Data as of | 15 September 2026 14:00 WIB |



