HSBC Stock Drops 1.89%, Testing Support Level In Focus
On September 17, 2026: price 1,507.80 GBp, trend sideways, RSI 42.7, support 1,497.20, resistance 1,580.20. technical analysis of hsbc stock.

HSBC Holdings slipped to 1,507.80 GBp on 15 September 2026 at 14:00 WIB, down 1.89% on the day, as the shares continued to trade below both the short-term and medium-term trend markers. The move matters because HSBC is not falling in isolation: the price is now sitting under the SMA20 at 1,534.05 and just above the SMA50 at 1,525.42, a setup that says the stock has lost some near-term momentum but has not yet broken its broader base. As shown in the chart, the shares are also pressing against the lower half of the recent range, with the market watching whether this becomes a routine pullback or the start of a deeper reset.
Trend & Price Action
The trend picture is best described as sideways, but with a slight downward bias in the short run. The SMA20 slope of 0.08% over 5 days is essentially flat, which usually signals a market lacking conviction rather than one in a clean uptrend or downtrend. Still, price being below the SMA20 and only modestly above the SMA50 tells investors that sellers have the upper hand in the immediate term, even if the longer base has not fully cracked. There is also no fresh MA-cross, meaning the moving averages are not giving a new trend-change signal; instead, they are pointing to hesitation. In plain terms, the chart is not showing a strong escape from the recent range, but it is also not confirming a decisive breakdown yet.
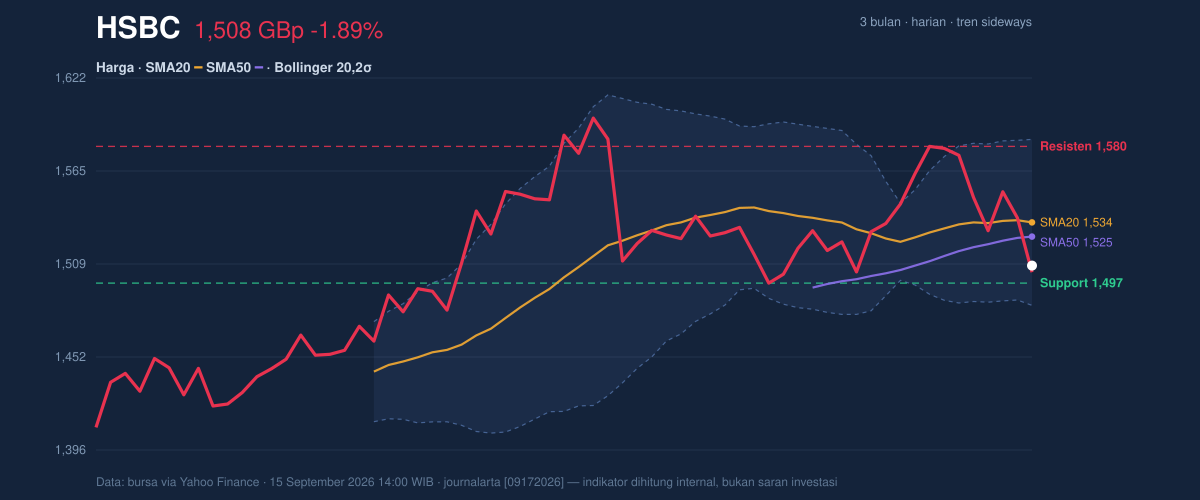
The location within the Bollinger Bands reinforces that message. With the price near the lower band at 1,483.67 and a %B of 24%, HSBC is trading in the lower quarter of its recent volatility envelope. That usually means the share price is weak relative to its own recent distribution, but not necessarily oversold enough to force an immediate rebound. The 6.6% band width is the more important signal: it shows the bands are squeezing, which often precedes a sharper move once the market picks a direction. A squeeze does not predict up or down; it says the current calm is compressing energy.
That is why the next few sessions matter more than the last few.
Oscillators & Momentum
The momentum gauges are mixed, but the bias is still negative. The RSI at 42.7 is neutral, which means the shares are neither overheated nor washed out. That matters because neutral RSI often leaves room for either a bounce or another leg lower, depending on whether buying interest returns. The more urgent signal is the Stochastic %K at 3.8 versus %D at 35.9, which places the stock in oversold territory. Stochastic is a short-term timing tool, so this reading says selling has been intense enough to stretch the price, but it does not guarantee a reversal unless price action confirms it.
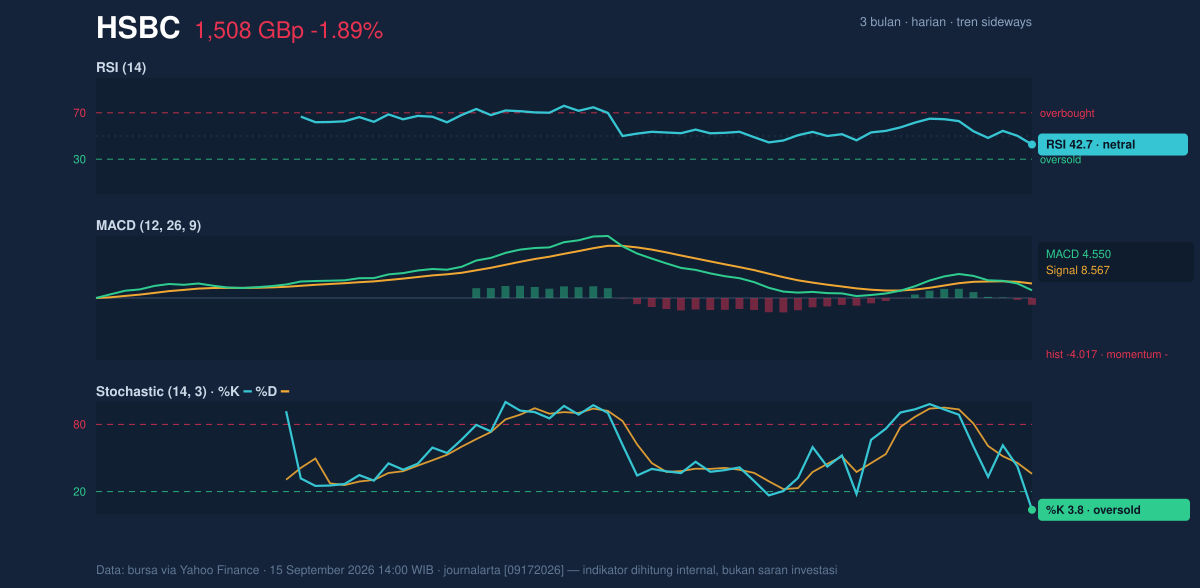
The MACD at 4.550 versus its signal at 8.567, with a histogram of -4.017, is the clearest momentum warning in the data. MACD below its signal line means recent price movement is weaker than the slower trend, and a negative histogram shows that gap is widening or at least still unresolved. In practical terms, this is not the sort of momentum profile that usually supports an immediate breakout higher. It says the market is still digesting the recent decline, even if the Stochastic is hinting that the move may be stretched.
Volatility & Volume
Volatility is present, but not extreme. The ATR(14) at 29.35, equal to 1.9% of price, suggests a normal-to-moderate daily swing environment for HSBC rather than a disorderly market. That matters because a stock can look weak on a quiet tape and then move sharply when volatility expands. Here, the Bollinger squeeze implies that a larger directional move may be building, while ATR says the market is not yet in panic mode. Volume adds a further layer: the latest turnover of 26,058,006 is about 1.4× normal, which means the latest decline was not happening on thin participation. When a drop comes with above-average volume and OBV is falling, it usually signals that distribution is taking place — more shares are changing hands on down days than on up days, a sign that sellers are still in control of the tape.
That combination — squeezed bands, heavier volume, and falling OBV — is what makes the current setup more than a routine drift.
Key Levels & Scenarios
The nearest support is 1,497.20, with resistance at 1,580.20. The current price is sitting at roughly 13% of the range, which means it is much closer to support than resistance and leaves limited cushion if the floor gives way. The 3-month low at 1,350.00 and 3-month high at 1,610.00 frame the broader trading box: HSBC is still well above the lower extreme, but it has lost enough ground to put the lower boundary back on the radar. The chart, as shown, makes the tactical question straightforward: can the shares hold the 1,497.20 area and reclaim the SMA20 at 1,534.05, or does weakness extend through the lower band?
If price stabilises above support and climbs back through the middle band and SMA20, the market would be signalling that the squeeze is resolving without a breakdown. If it fails to hold 1,497.20, the next reference point becomes the lower part of the recent range rather than the moving averages.
Technical Verdict: HOLD (wait & see)
- RSI 42.7 is neutral, so the stock is not oversold enough on its own to confirm a reversal.
- Stochastic 3.8 / 35.9 shows oversold short-term pressure, but MACD 4.550 below signal 8.567 keeps momentum negative.
- Price below SMA20 1,534.05, with a Bollinger squeeze and OBV falling, suggests the market is coiled but not yet confirmed in either direction.
Verdict invalidated if price falls below 1,497.20, because that would weaken the nearest support and shift attention toward the lower band and the broader range floor.
- Ideal Entry Range: 1,497.20 to 1,534.05
- Exit Target (Target Price): 1,580.20
- Stop Loss protection: below 1,497.20
In plain English: HSBC is not showing a clean trend signal yet, so the chart is asking for patience until support or resistance gives way.
HSBC’s 3-month low remains 1,350.00.
Summary Data HSBC
| Last price | 1,507.80 GBp |
| Change 1 day / 5 days / 1 month | -1.89% / -4.25% / -1.52% |
| Trend / MA-cross | sideways / none |
| SMA20 / SMA50 | 1,534.05 / 1,525.42 |
| RSI (14) / Stochastic %K | 42.7 / 3.8 |
| Bollinger %B / ATR | 24% / 29.35 |
| Support / Resistance 20 days | 1,497.20 / 1,580.20 |
| Data as of | 15 September 2026 14:00 WIB |



