AstraZeneca Testing Key Resistance: Stock Gains 0.58% (September 21, 2026)
On September 21, 2026: price 12,500.00 GBp, trend sideways, RSI 59.6, support 11,650.00, resistance 12,500.00. technical analysis of astrazeneca stock.

AstraZeneca’s shares on the London Stock Exchange were last quoted at 12,500.00 GBp, up 0.58% on the day and extending a 6.76% gain over five days, according to market data from Yahoo Finance. That move matters because it has pushed the stock to the very top of its short-term range, with the price now sitting at 100% of the 20-hour range and just beneath the upper Bollinger band, a setup that often signals either continuation or a pause after a fast run.
Trend & Price Action
The bigger picture is not a clean breakout trend, but a sideways structure with a rising bias. The stock is trading above the SMA20 at 12,080.10 and also above the SMA50 at 12,193.48, which tells traders that recent buying has been strong enough to lift price back over both short- and medium-term averages. There is no new MA-cross, so this is not yet a fresh moving-average trend reversal; instead, it looks more like an advance inside a broader consolidation.
That distinction matters. A sideways market with price above both averages usually means buyers have regained control, but not decisively enough to reset the whole trend. The SMA20 slope of 0.99% over five days shows the short-term average is still tilting higher, which supports the recent advance. As shown in the chart, the stock is also trading close to the top of its recent structure, which is where momentum traders often watch for either continuation above resistance or a fade back toward support.
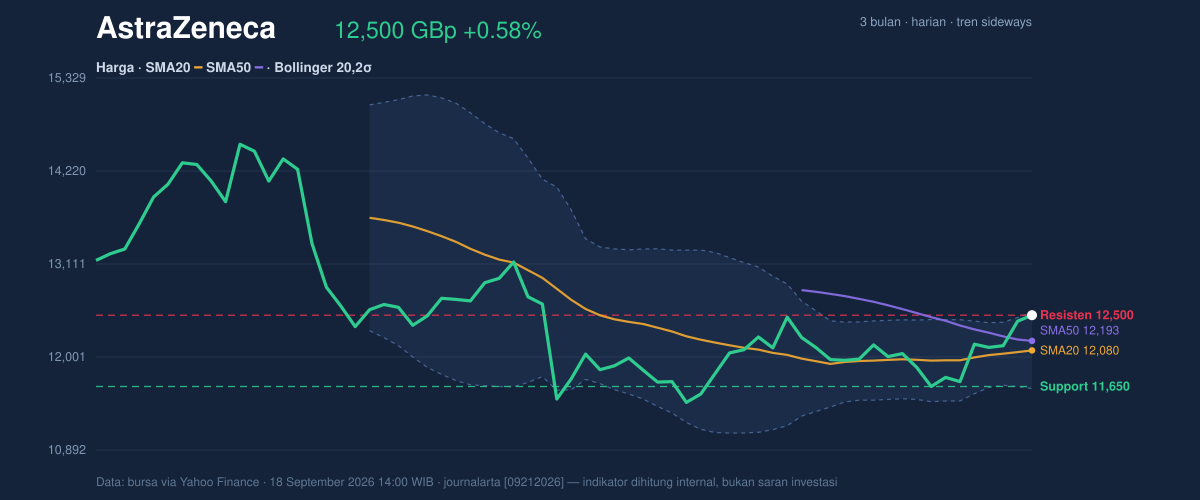
The immediate ceiling is clear at 12,500.00, which is also the latest price. That makes this level both a technical marker and a psychological one. When price closes right on resistance, the market is effectively asking whether buyers have enough conviction to absorb supply at the top of the range.
Oscillators & Momentum
Momentum is mixed, and that mix is the key signal here. The RSI at 59.6 is still neutral, which means the stock is not yet in an extreme condition despite the recent rise. By contrast, the Stochastic at 90.8 / 89.8 is overbought, showing the shares have moved quickly enough that short-term traders may already be crowded in. In plain language, RSI says the move is not stretched overall, while Stochastic says the move is stretched in the near term.
That divergence is important because it often appears near short-term turning points, especially when price is pressing against resistance. It does not automatically mean reversal, but it does mean the stock may need either a pause or a strong follow-through to justify higher levels. The chart’s momentum panel shows a more constructive MACD reading: MACD 8.057 versus a signal of -74.232, with a histogram of 82.289. That is a strong positive spread, and it signals that trend momentum has shifted decisively upward in the short run.
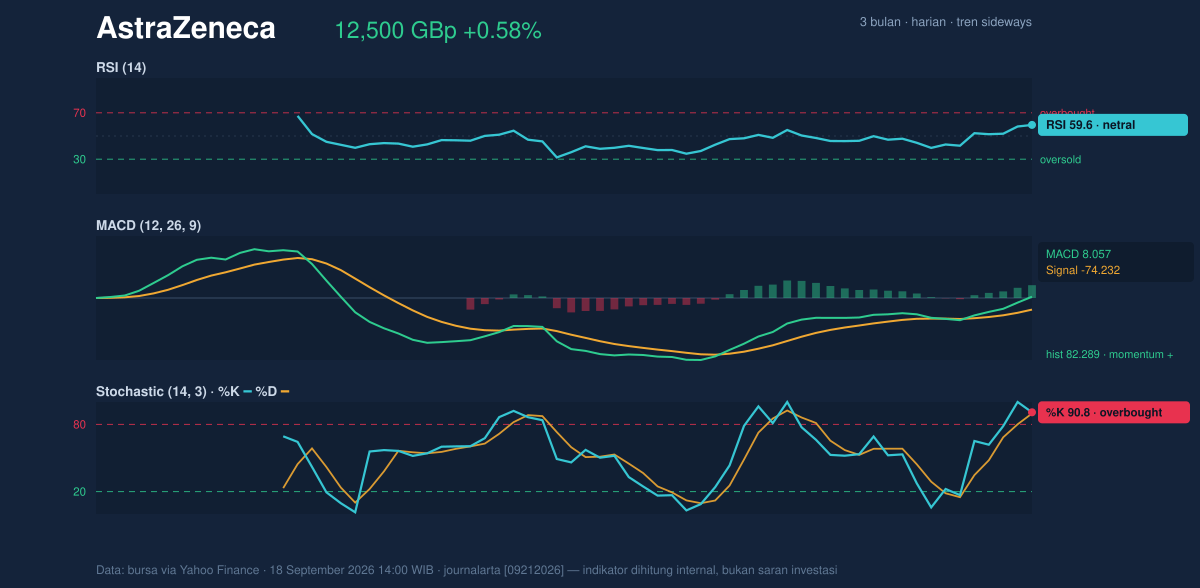
So the momentum picture is not one-sided. The MACD and rising price action support the recent advance, but the overbought Stochastic warns that the stock may be running hot in the immediate term. That combination often leads to either a brief consolidation or a breakout attempt that needs volume to stick.
Volatility & Volume
Volatility is moderate, not explosive. The ATR(14) at 310.99 equals about 2.5% of price, which means daily swings are meaningful but not disorderly. More importantly, the Bollinger Bands are tightening: the band width is 7.5%, described in the data as a squeeze. In technical terms, a squeeze means volatility has compressed, often before a sharper move. It does not predict direction on its own, but it does tell us the market is storing energy.
Price is also sitting near the upper band at 12,534.48, with the middle band at 12,080.10 and the lower band at 11,625.72. A close near the top band, with %B at 96%, shows the stock is trading very close to the top of its recent volatility envelope. That usually reflects strong demand, but it can also leave less room for error if buyers fail to extend the move.
Volume is the other important confirmation. Last volume was 6,543,165, more than 2.1× the 20-hour average of 3,104,648, and OBV is rising. That combination suggests the move is being supported by participation rather than by thin trading. In practical terms, rising OBV means money flow has been accumulating alongside price, which makes the recent advance look more credible than a low-volume drift higher.
Key Levels & Scenarios
The nearest support is 11,650.00, which also sits close to the lower part of the Bollinger structure. If price holds above that zone, the current constructive setup remains intact. If it fails, the market would likely be signaling that the recent breakout attempt has lost momentum and that the stock may revert toward the mid-band area around 12,080.10.
On the upside, 12,500.00 is the immediate resistance to watch, and the upper Bollinger band at 12,534.48 is the next technical marker just above it. A sustained move through that area would be more convincing if volume stays elevated, because the chart already shows the stock is stretched near the top of its range. The broader reference points remain the 3-month high at 15,126.00 and the 3-month low at 9,892.00, which frame how much room the stock still has to move within a wider band of historical trading.
Technical Verdict: HOLD (wait & see)
HOLD (wait & see)
- Reason 1: MACD is positive and the histogram is strongly supportive, which confirms upward momentum.
- Reason 2: Price is above SMA20 and SMA50, showing the short-term structure has improved.
- Reason 3: Stochastic is overbought and price is at %B 96%, so the stock is extended near resistance and may need confirmation.
Verdict invalidated if price falls below 11,650.00, which would damage the current support structure and weaken the bullish momentum case.
- Ideal Entry Range: 11,650.00 to 12,080.10
- Exit Target (Target Price): 12,534.48
- Stop Loss protection: below 11,650.00
For non-traders, this means the shares are strong, but they are also close to a level where they may pause before proving they can go further.
Summary Data AstraZeneca
| Last price | 12,500.00 GBp |
| Change 1 day / 5 days / 1 month | 0.58% / 6.76% / 3.41% |
| Trend / MA-cross | sideways / none |
| SMA20 / SMA50 | 12,080.10 / 12,193.48 |
| RSI (14) / Stochastic %K | 59.6 / 90.8 |
| Bollinger %B / ATR | 96% / 310.99 |
| Support / Resistance 20 days | 11,650.00 / 12,500.00 |
| Data as of | 18 September 2026 14:00 WIB |

