HSBC Stock Technicals Today: Drops 0.64%, Testing Support Level
On September 25, 2026: price 1,499.80 GBp, trend sideways, RSI 46.7, support 1,503.80, resistance 1,580.20. technical analysis of hsbc stock.

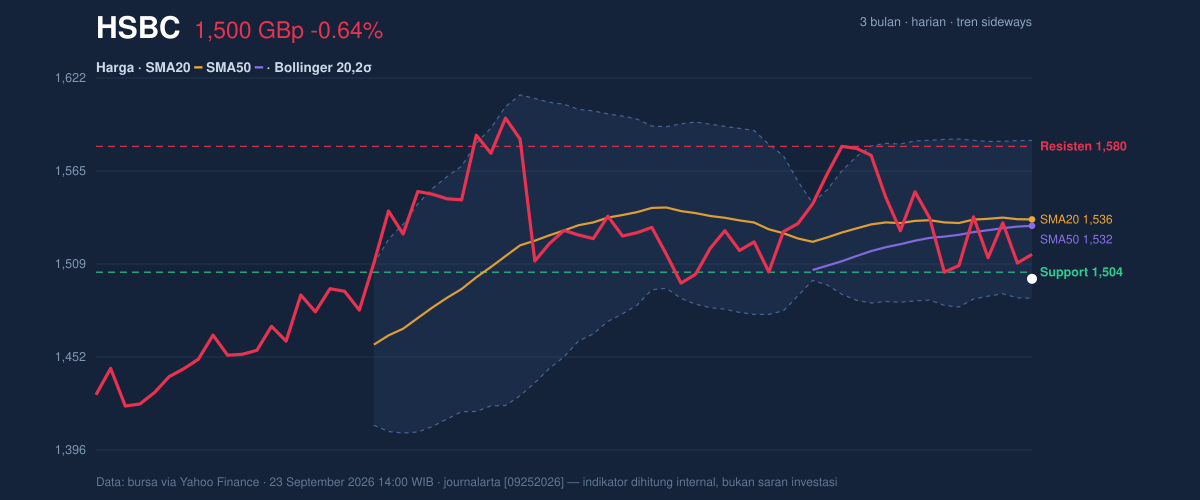
HSBC Holdings ended at 1,499.80 GBp on the LSE, slipping below the 1,503.80 short-term support as the shares stayed in a sideways pattern and closed near the lower edge of their recent range. The move matters less for the size of the daily decline than for the positioning: the stock is now trading under both the SMA20 at 1,535.89 and the SMA50 at 1,532.00, which tells the market that recent price action has weakened enough to sit below both the short- and medium-term trend markers. As shown in the chart, that leaves HSBC in a technically fragile zone where even modest selling pressure can keep the shares pinned near the lower Bollinger band.
Trend & Price Action
The broader message from the chart is not a breakdown, but a market that has lost upward traction. The trend is sideways, and the SMA20 slope of 0.14% over 5 days suggests only a very mild upward drift, not a decisive recovery. More importantly, there is no fresh MA-cross, so the usual signal of one moving average overtaking another — often read as a change in trend leadership — has not arrived. With price below both moving averages, the chart is telling investors that HSBC is still trading under overhead supply, meaning rallies may meet sellers who bought at higher levels and want out near breakeven.
The stock is also sitting 5% below the 20-hour range midpoint area, which reinforces that the current move is weak even if it is not dramatic. The 3-month high of 1,610.00 remains the ceiling to beat, while the 3-month low of 1,350.00 shows there is still a wide historical floor beneath the market. That gap matters: HSBC is not in freefall, but it is also not close enough to the upper end of the range to suggest buyers have regained control.
Oscillators & Momentum
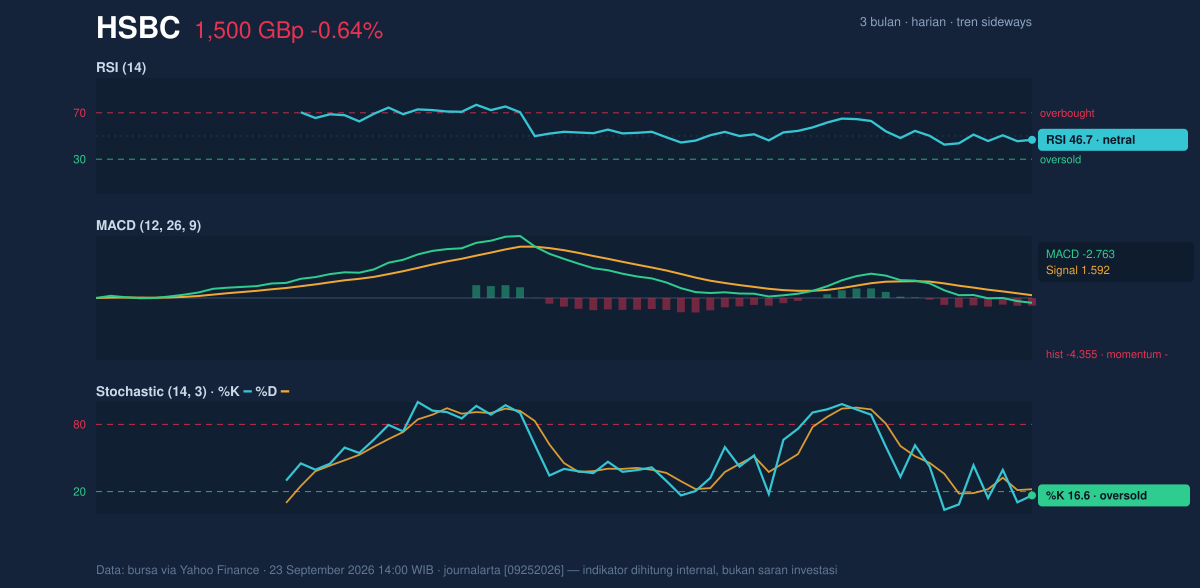
Momentum is mixed, and that is the key tension in this name. The RSI at 46.7 is neutral, which means the stock is neither stretched on the upside nor washed out on the downside. But the Stochastic %K at 16.6 and %D at 22.1 point to an oversold condition, a sign that short-term selling may be getting tired even if the broader trend has not turned. In plain language, the oscillators are saying the shares have been pressured enough to look technically cheap in the very short term, but not enough to confirm a durable rebound.
That caution is reinforced by the MACD at -2.763, with the signal line at 1.592 and a histogram of -4.355. MACD measures whether price momentum is accelerating or fading; here, the negative histogram shows downside momentum still dominates. So while the Stochastic hints at a possible bounce, MACD says the larger force is still downward. That mismatch usually produces choppy trading rather than a clean trend change.
Oversold short-term, but still negative underneath.
Volatility & Volume
The Bollinger setup is one of the more important signals in this chart. HSBC is near the lower band at 1,487.96, with %B at 12%, which means price is very close to the bottom of the recent volatility envelope. When a stock trades this low inside its Bollinger bands, it often signals that the market is pricing in a lot of near-term weakness already. But the more telling detail is the 6.2% band width, which is narrowing. A squeeze like this suggests volatility has been compressed and a more forceful move may be building. That move can be up or down; the squeeze itself does not choose direction.
Volume does not yet provide a strong confirmation either way. The latest reading of 19,485,821 is only about 1.0× normal versus the 20-hour average of 20,062,498, so the decline is not being driven by a major surge in participation. At the same time, OBV is falling, which means cumulative volume flow is still favoring sellers. In practical terms, that suggests the market has not yet seen the kind of broad buying pressure that would normally accompany a clean technical turn.
Volatility is tightening, but volume is not yet confirming a reversal.
Key Levels & Scenarios
The first level to watch is 1,503.80, the short-term support. HSBC is already below it, so this area now acts as an immediate reclaim zone rather than a floor. If the shares can move back above that line and then retake the SMA50 at 1,532.00 and SMA20 at 1,535.89, the chart would start to look less fragile, especially if price also pushes back toward the Bollinger middle band at 1,535.89. On the upside, the next clear resistance is 1,580.20, and beyond that the upper Bollinger band at 1,583.82 marks the top of the current volatility range.
On the downside, the lower Bollinger band at 1,487.96 is the nearest technical line in the sand. A clean break below that area would suggest the squeeze is resolving to the downside and could expose the market to a deeper test of the broader range. With the stock already near the bottom of its recent structure, the market is effectively waiting for a decisive move to confirm whether this is just a pause or the start of another leg lower.
Technical Verdict: HOLD (wait & see)
HOLD (wait & see) fits best because the chart is conflicted: Stochastic is oversold, which leaves room for a bounce, but MACD remains negative and price is still below the SMA20 and SMA50. The narrow Bollinger band also suggests a breakout is possible, but not yet directional. The verdict is invalidated if price falls below 1,487.96, because that would confirm downside pressure is escaping the current range.
- Ideal Entry Range: 1,487.96 to 1,503.80
- Exit Target: 1,532.00 to 1,535.89, then 1,580.20 if momentum improves
- Stop Loss protection: below 1,487.96
For non-traders, this means HSBC is sitting at a technically sensitive point where a bounce is possible, but the chart has not yet proven that the weakness is over.
HSBC’s nearest technical trigger is 1,487.96, the lower Bollinger band.
Summary Data HSBC
| Last price | 1,499.80 GBp |
| Change 1 day / 5 days / 1 month | -0.64% / -0.53% / -1.13% |
| Trend / MA-cross | sideways / none |
| SMA20 / SMA50 | 1,535.89 / 1,532.00 |
| RSI (14) / Stochastic %K | 46.7 / 16.6 |
| Bollinger %B / ATR | 12% / 30.64 |
| Support / Resistance 20 days | 1,503.80 / 1,580.20 |
| Data as of | 23 September 2026 14:00 WIB |



