Tencent Stock Analysis: Drops 0.59%, Momentum Gains
On September 25, 2026: price 438.40 HKD, trend sideways, RSI 49.4, support 419.00, resistance 455.20. technical analysis of tencent stock.

Tencent Holdings edged lower on the Hong Kong market on 24 September 2026, with 0700.HK last at 438.40 HKD after a 0.59% daily decline, even as the share price stayed above its 20-day moving average at 436.71, according to Yahoo Finance data. The message from the tape is not dramatic, but it is important: Tencent is still trading inside a broad sideways band, and the market is waiting for a cleaner signal before committing to a stronger trend. That hesitation shows up in the indicators as a market that is neither broken nor convincingly accelerating.
Trend & Price Action
The stock’s immediate structure is best described as range-bound, not trending. Tencent is above SMA20 but below SMA50 at 450.28, which tells readers that short-term price action has improved enough to sit above the near-term average, yet it has not reclaimed the medium-term trend line. In plain terms, the share is hovering in the middle of the road: not weak enough to signal outright breakdown, but not strong enough to show a decisive recovery. The absence of a fresh MA-cross also matters. A moving-average crossover is often watched as a trend confirmation signal; without one, the chart is still in a transition phase rather than a confirmed directional move.
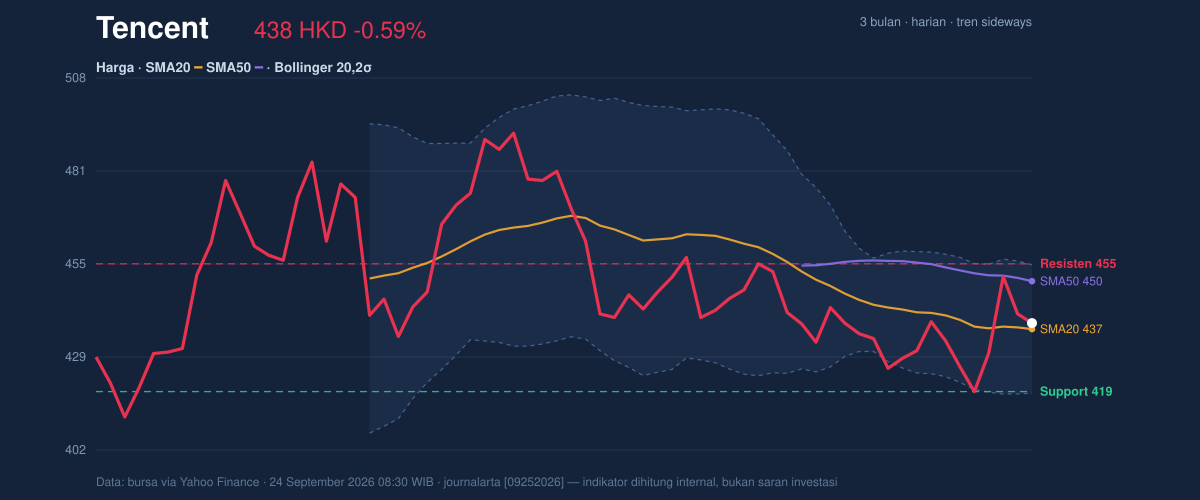
The Bollinger Bands reinforce that reading. With price at 438.40 and the middle band at 436.71, Tencent is only slightly above the band’s center, while the upper band sits at 454.91 and the lower band at 418.51. That places the stock in the upper half of its recent range, but not near the top of it. The band width of 8.3% is normal, which suggests the market is not compressed enough to imply an imminent squeeze-driven breakout, nor wide enough to indicate a panic move. The chart shows balance, not urgency.
A short pullback, not a breakdown.
Oscillators & Momentum
The momentum picture is more constructive than the price trend alone suggests. RSI at 49.4 is neutral, which means the stock is neither overbought nor oversold; it is sitting close to equilibrium. That matters because neutral RSI in a sideways trend usually signals indecision rather than exhaustion. Stochastic is also neutral, with %K at 43.7 and %D at 55.6, showing that short-term momentum is still below its faster signal line but not in a deeply oversold state. In other words, the stock has not yet generated a strong upside trigger from the oscillator set.
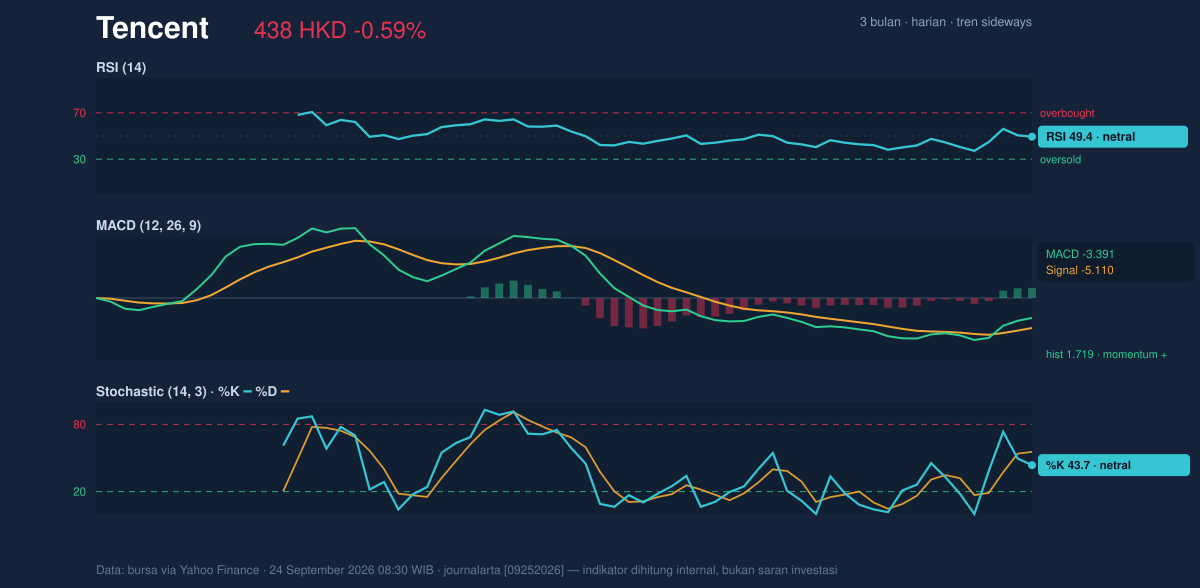
The more interesting signal comes from MACD. Tencent’s MACD is -3.391, still below zero, but the histogram at 1.719 is positive and the signal line at -5.110 sits below MACD. That combination suggests momentum is improving even though the broader trend has not fully turned. For general readers, this is the difference between “still under pressure” and “pressure is easing.” MACD is not shouting breakout, but it is no longer pointing to worsening downside momentum.
Volatility & Volume
Volatility is moderate, not explosive. ATR at 11.69, equal to 2.7% of price, indicates that Tencent can still move meaningfully in a day, but the stock is not in a highly unstable phase. That fits with the Bollinger setup: normal band width, mid-band positioning, and no squeeze. The market appears to be drifting rather than repricing aggressively.
Volume adds a useful layer of context. Last session’s volume of 14,277,944 was only 0.7× the 20-session average of 21,260,114, which means the latest dip did not come with heavy selling pressure. That is a subtle but important sign. Declines on low participation often carry less conviction than declines on surging turnover. At the same time, OBV is rising, meaning the cumulative volume trend is still improving even if the single-day print was light. Put simply, the stock is not being abandoned; it is being watched.
Key Levels & Scenarios
The market map is clear. Support at 419.00 is the first important floor, and it sits close to the lower Bollinger band at 418.51. That alignment makes the area technically meaningful: if price slips there, the band and support are likely to be tested together. On the upside, resistance at 455.20 lines up closely with the upper Bollinger band at 454.91, which means the stock will need more than a routine bounce to get through that ceiling. The current price is also at 54% of the 20-hour range, so it is neither near support nor near resistance — again a sign of balance.
The broader three-month range gives the story more context. Tencent’s 3-month high is 497.80 and the 3-month low is 411.00. Price is closer to the lower end of that range than the high, which tells readers the stock has recovered from its weakest point but has not rebuilt enough strength to challenge the upper part of the band.
If price holds above 436.71 and volume improves, the chart could attempt a move toward 450.28 and then 455.20. If it loses 419.00, the lower band at 418.51 becomes the next technical reference, and the chart would start to look more fragile.
Technical Verdict: HOLD (wait & see)
- Price is above SMA20, which keeps the short-term structure intact, but it remains below SMA50, so the medium-term trend is not yet repaired.
- RSI at 49.4 and Stochastic at 43.7 / 55.6 are neutral, while MACD is improving with a positive histogram, pointing to better momentum but not a confirmed breakout.
- Volume is only 0.7× normal, so the latest move lacks strong participation even though OBV is rising.
- Verdict invalidated if price breaks below 419.00, because that would put the stock through support and toward the lower Bollinger boundary.
- Ideal Entry Range: 419.00 to 436.71
- Exit Target: 450.28 to 455.20
- Stop Loss protection: below 418.51, with 411.00 as the deeper reference from the 3-month low
For non-traders: Tencent is still stuck in a waiting pattern, where the chart is improving but not yet strong enough to signal a decisive move.
“The market is not rejecting Tencent — it is asking it to prove itself.”
Summary Data Tencent
| Last price | 438.40 HKD |
| Change 1 day / 5 days / 1 month | -0.59% / 2.91% / -2.10% |
| Trend / MA-cross | sideways / none |
| SMA20 / SMA50 | 436.71 / 450.28 |
| RSI (14) / Stochastic %K | 49.4 / 43.7 |
| Bollinger %B / ATR | 55% / 11.69 |
| Support / Resistance 20 days | 419.00 / 455.20 |
| Data as of | 24 September 2026 08:30 WIB |


