Shell Stock Gains 3.73% Today, Testing Key Resistance
On September 25, 2026: price 3,641.00 GBp, trend uptrend, RSI 61.8, support 3,311.00, resistance 3,652.50. technical analysis of shell stock.

Shell plc rose on the London Stock Exchange on 23 September, with the shares last changing hands at 3,641.00 GBp, up from a previous close of 3,510.00 GBp, as the stock pressed close to the top of its recent trading band. The move matters because it leaves Shell trading in the upper end of a still-intact uptrend, but the latest indicators also show that momentum is not fully synchronized with price, which often means the market is testing how far the rally can travel before it needs a pause.
Trend & Price Action
The broader structure remains constructive. Shell is trading above both the SMA20 at 3,492.05 and the SMA50 at 3,385.50, a setup that usually signals buyers still control the medium-term tape. The SMA20 is rising at 0.92% over five days, which is important because a rising short-term average often shows that recent gains are being sustained rather than fading immediately after a jump.
There has been no fresh moving-average crossover, so the chart is not flashing a new trend acceleration signal, but neither is it warning of a breakdown. As shown in the chart, Shell is also sitting near the top of its range, with the price at 97% of the 20-hour range and just below the 20-hour resistance at 3,652.50. That position tells readers the market is no longer cheap relative to the latest swing, and that every extra step higher now requires more buying pressure to overcome overhead supply.
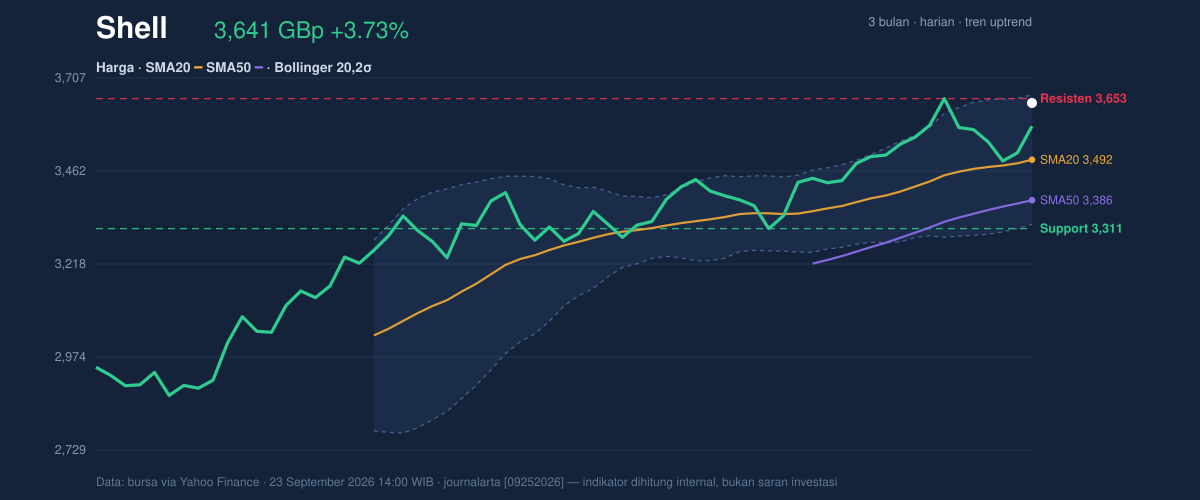
The broader three-month map reinforces that point. Shell’s 3-month high is 3,663.50, only slightly above the current level, while the 3-month low is 2,559.50. In plain terms, the share price is operating near the upper boundary of its recent range, where rallies often become more sensitive to profit-taking.
Oscillators & Momentum
The momentum picture is mixed rather than broken. The RSI at 61.8 is still neutral, which means the stock is not yet in a classic overbought zone even after the recent rise. That is a useful distinction: price can be near resistance without momentum being exhausted, and that is exactly the kind of setup traders watch for continuation or rejection.
The Stochastic %K at 68.6 versus %D at 49.9 also sits in neutral territory, but it is leaning firmer than the RSI and suggests short-term buying interest remains present. The caution comes from the MACD at 56.439 below its signal line at 62.591, with a histogram of -6.152. That negative histogram means the upward trend in price is not yet fully confirmed by trend-following momentum; in other words, the shares are rising, but the pace of that rise has slowed enough to create a mild divergence.
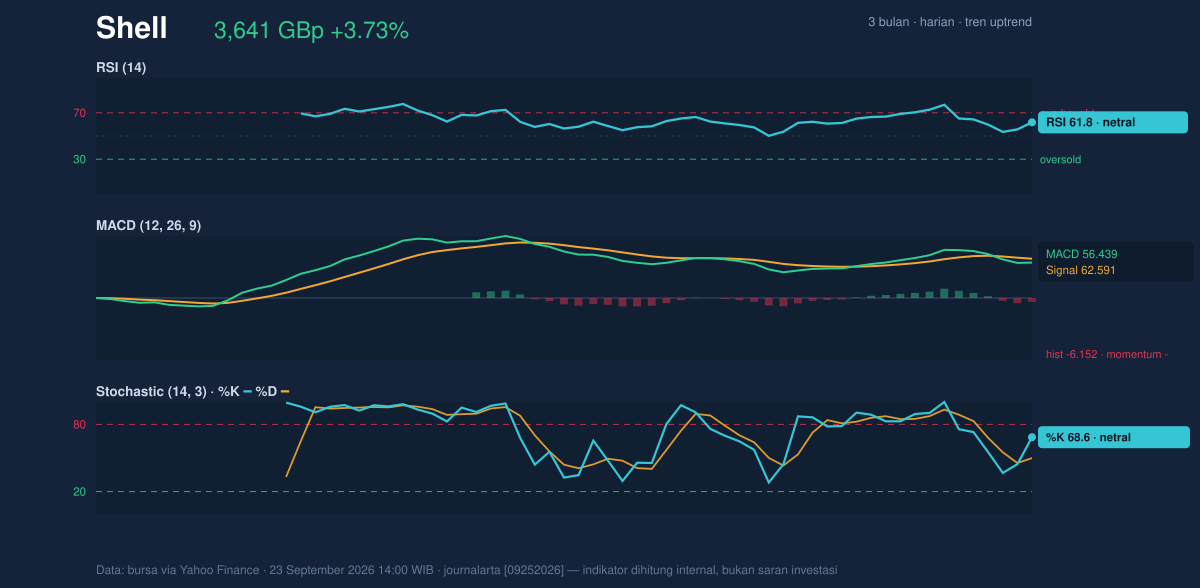
This is the key signal in the chart set. When price holds near highs while MACD stays negative, the market is often in a decision zone: either momentum catches up and the move extends, or the stock stalls and resets toward support. The indicators do not point to a reversal by themselves, but they do say the advance is not yet running on full strength.
Volatility & Volume
Volatility is moderate rather than extreme. The ATR at 65.77, equal to 1.8% of price, suggests the stock can still move meaningfully in a session, but not in the kind of disorderly fashion that usually accompanies panic or capitulation. Bollinger Bands add another layer: the upper band is 3,662.22, the middle band is the SMA20 at 3,492.05, and the lower band is 3,321.88. With %B at 94%, Shell is trading very close to the top of the band structure, which often indicates stretched short-term positioning rather than immediate weakness.
The band width is 9.7%, described as normal, so this is not a squeeze setup. That matters because a squeeze would imply compressed volatility and a likely breakout pending; here, the market is already moving, but without the kind of compression that usually precedes a sharp expansion. Volume adds a further nuance: last volume was 7,990,133, below the 20-day average of 10,560,042, or 0.8x normal. That means the latest rise has not been accompanied by heavy participation, which slightly weakens the case for a decisive breakout. Still, OBV is rising, so cumulative volume flow has not turned against the trend; buyers have been willing to accumulate over time even if the latest session was not especially busy.
Key Levels & Scenarios
The immediate map is clear. Support sits at 3,311.00, while resistance stands at 3,652.50. With the price already near resistance, the market is effectively asking whether Shell can convert a near-high position into a clean breakout. If it does, the next reference is the 3-month high at 3,663.50, which is the nearest visible ceiling from the data. If it fails, the first area to watch is the Bollinger middle band at 3,492.05, because that is both a moving-average anchor and a natural mean-reversion point.
The strongest bullish signal would be a close above 3,652.50 with momentum confirmation from MACD. The strongest warning would be a loss of 3,311.00, which would mean the stock has slipped back through the lower edge of its recent range and the current uptrend is losing structure.
Technical Verdict: HOLD (wait & see)
HOLD (wait & see) — the trend is positive, but momentum is not fully confirming the price position near resistance.
- Reason 1: Price is above SMA20 and SMA50, and the SMA20 is rising, which supports the broader uptrend.
- Reason 2: MACD is negative versus its signal line, so the rally is not yet showing full momentum confirmation.
- Reason 3: Price is near resistance and near the upper Bollinger band, with %B at 94%, which suggests limited room before the market needs either a breakout or a reset.
Verdict invalidated if price breaks below 3,311.00.
- Ideal Entry Range: 3,492.05 to 3,321.88
- Exit Target: 3,652.50 to 3,663.50
- Stop Loss protection: below 3,311.00
In plain English, Shell looks technically healthy, but the chart is asking for confirmation before the next leg higher can be trusted.
“Right now the market is close enough to resistance that every new pound of strength has to prove itself.”
Summary Data Shell
| Last price | 3,641.00 GBp |
| Change 1 day / 5 days / 1 month | 3.73% / 1.80% / 7.52% |
| Trend / MA-cross | uptrend / none |
| SMA20 / SMA50 | 3,492.05 / 3,385.50 |
| RSI (14) / Stochastic %K | 61.8 / 68.6 |
| Bollinger %B / ATR | 94% / 65.77 |
| Support / Resistance 20 days | 3,311.00 / 3,652.50 |
| Data as of | 23 September 2026 14:00 WIB |



